
[2/5] Statistic for Business Technique: Cohort Analysis
The second part of the email course series regarding Statistic for Business Technique


Hello all! This is the second part of the Statistic for Business Technique Email Course I have started recently. This course intended to give knowledge regarding the statistic technique people could use to analyzing data that the business people understand. If you miss the first part, you could check out the course below.

In the second part, I want to introduce an interesting statistical technique used for business behavioral analysis called Cohort Analysis.
Cohort Analysis
What is Cohort Analysis? It is an analysis performed on the group of data to assess the group's behavior. Cohort analysis comes from the Cohort word, which means a group of people who have something in common—which implies that cohort analysis is an analysis of the group behavior.
Businesses often use cohort analysis to understand the life cycle of the customers, especially over time. For example, when you do a campaign or change the product, would it affect the revenue or retention—that is when you use the Cohort Analysis. You want to analyze different cohorts to better understand the pattern and trend of the business target.
Let me give you an example in the image below.

You have customers who subscribe to your websites in June, July, and August. You want to compare the retention of the customers after 3 months in between different cohorts (customers in June, July, and August). This is basically how cohort analysis compares the different groups of customers as your business needs.
Cohort Analysis Types
There are 3 types of Cohort Analysis depending on the cohort, they are:
Time-Based Cohort
This cohort analysis is similar to what I mentioned above and the most used kind of cohort. The analysis divides the data using different time-frame to group the data.
Time-Based cohort analyses are useful for the experiment that depend on the time—for example, revenue over time, churn, offering, campaign, and many more.
Segment-Based Cohort
Segment-based cohort grouping the data into different groups based on the similarities characteristics that businesses have decided. For example, we could do segment-based cohort analysis on customers’ products or customers’ logs time.
The point of a Segment-based cohort is to see if the business doing well based on this cohort. For example, if a customer who brought product X is less likely to buy another product than the customer who owns Product Y, then there is something that we could analyze.
Size-Based Cohort
Lastly, Size-Based cohort groups the data by the size of the data group—often, it is divided by the Monetary value. For example, customers’ tier level subscriptions or the customers’ business size.
Similar to the above, the Size-Based cohort is useful to see how our business is in different levels of customers. For example, customers who subscribe to higher tier levels are less likely to churn than the lower level.
Cohort Analysis Example
Let’s use a dataset example to understand how to do Cohort Analysis. In this example, I would use the Online Retail dataset from Kaggle. Let’s read the data first.
import datetime
import pandas as pd

df = pd.read_excel('Online Retail.xlsx')
df.head()
In this dataset, we have a dataset regarding customer purchases in the Online store. Using the Cohort Analysis, we want to analyze the Retention rate of the customers from their first purchase in a monthly manner. This analysis means what we do is Time-Based Cohort Analysis. Let’s acquire the month when the transaction happened and group them based on the first month (CohortMonth).
def get_month(x): return datetime.datetime(x.year, x.month, 1)

df['InvoiceMonth'] = df['InvoiceDate'].apply(get_month)
grouping = df.groupby('CustomerID')['InvoiceMonth']
df['CohortMonth'] = grouping.transform('min')
df.head()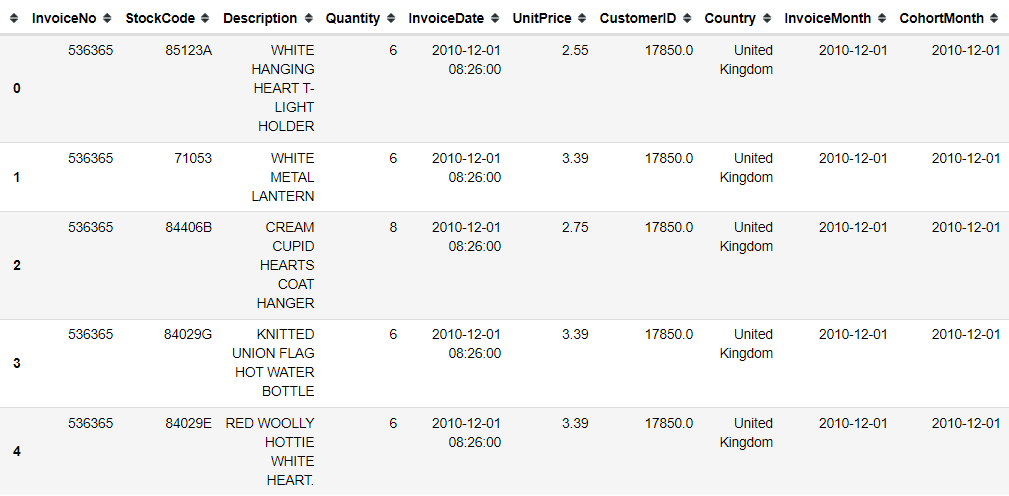
With the InvoiceMonth and CohortMonth columns, we would get the transaction month and the cohort month as the group. Using this data, we need to get the differences between the transaction time and the cohort. Let’s obtain that data.
def get_date_int(df, column):
    year = df[column].dt.year
    month = df[column].dt.month
    return year, month

invoice_year, invoice_month= get_date_int(df, 'InvoiceMonth')
cohort_year, cohort_month = get_date_int(df, 'CohortMonth')

years_diff = invoice_year - cohort_year
months_diff = invoice_month - cohort_month

df['CohortIndex'] = years_diff * 12 + months_diff + 1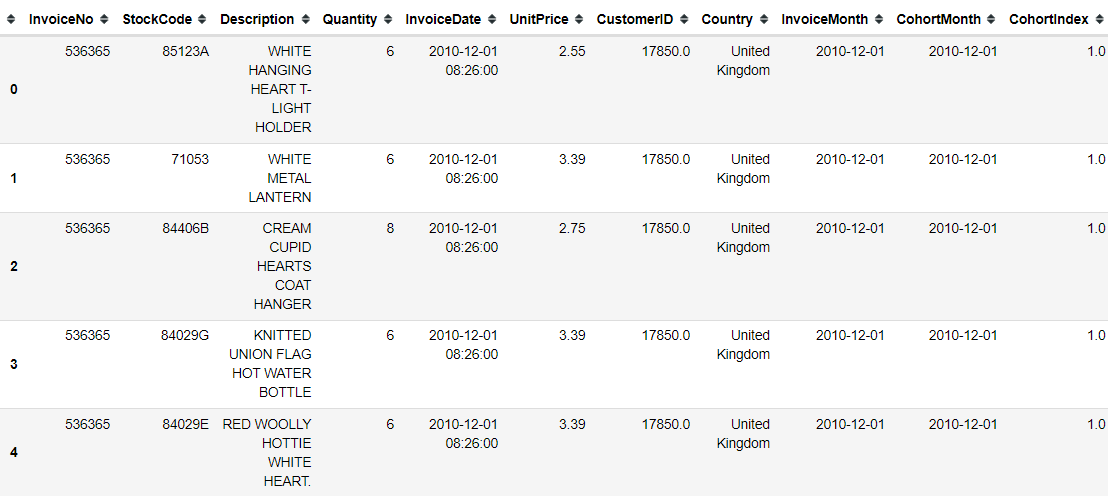
With month differences (CohortIndex) data, we could now group the data based on this month's differences and calculate the Retention Rate of the Customers.
#Count the Customers who still rebuying from their first purchases
grouping = df.groupby(['CohortMonth', 'CohortIndex'])
cohort_counts = grouping['CustomerID'].apply(pd.Series.nunique).reset_index().pivot(index='CohortMonth',columns='CohortIndex',values='CustomerID')

cohort_counts
Above is the Retention Customer counts, but it is hard to analyze and doesn't give us too much insight. We should plot this data and try to calculate it based on the percentage.
cohort_sizes = cohort_counts.iloc[:,0]
retention = cohort_counts.divide(cohort_sizes, axis=0)
retention.index=retention.index.date

plt.figure(figsize=(12,10))
plt.title('Retention Rates')

sns.heatmap(data = retention,
           annot = True,
           fmt = '.0%',
           vmin= 0.0,
           vmax=0.5,
           cmap='summer_r')
plt.show()
Above is the result of the cohort count plotting that we already transformed into a percentage. As we can see, the customers from December 2010 have a better Retention rate overall, and the longer the customers have been with the Online store, the higher the retention rate is.
Conclusion
Cohort Analysis is a statistical technique often used in the business to gain insight based on the group. The analysis could be used for many occasions to calculate customer retention rate or revenue over time. There are 3 types of Cohort Analysis:
Time-Based
Segment-Based
Size-Based
That is all about the Cohort Analysis. I hope it is useful to you. Let’s see you again in the next part. Please consider subscribing if you want to support me and accessing the paid-only content!