


Most market data providers don’t cover everything. So we end up with one vendor for US equities, another for Asia, and another for forex or crypto. Each has its own authentication, endpoints, and field names.
I chose Infoway because it covers six equity markets alongside forex, futures, and crypto, with real-time streaming across all of them. I wanted to see how well that promise held up in practice, so I built a price-alert dashboard that monitors nine markets simultaneously.
The build starts with live prices and historical candles, then moves to order-book data and streaming, and finally brings everything together into a single dashboard with alerts against a previous-close baseline.
Let’s get into it.
What the API covers
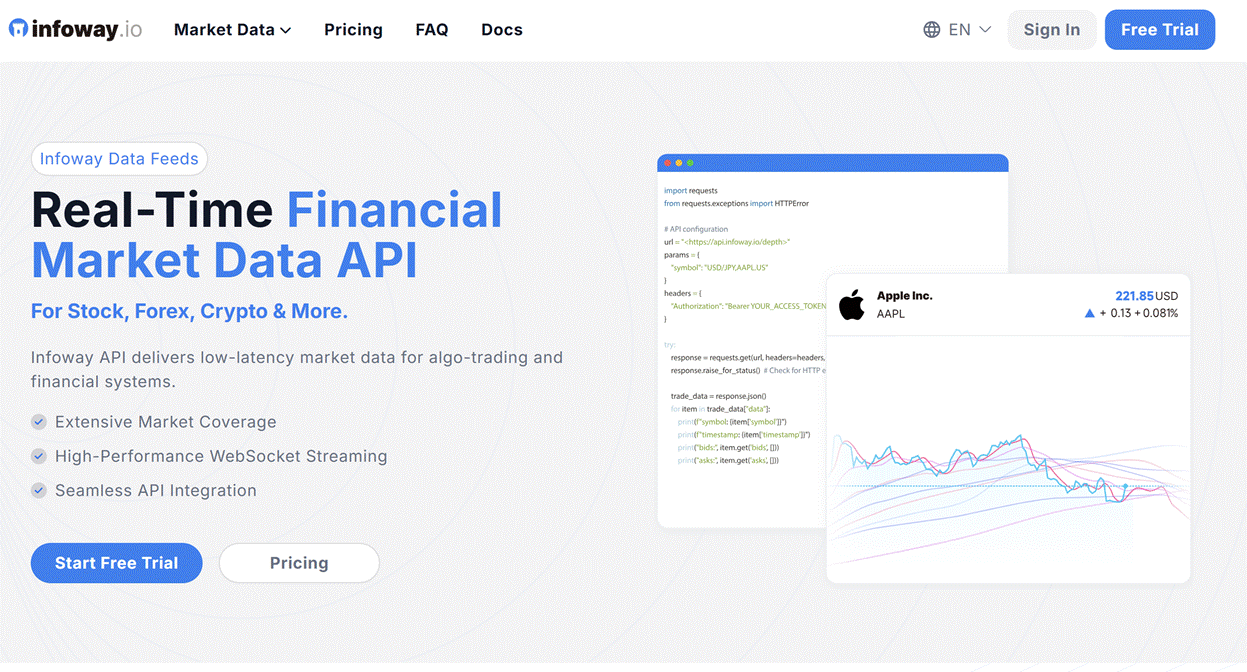
A market data API does two things. It tells us what an asset is trading at now or where it closed last Tuesday, and it streams new prices as trades occur. Infoway supports both across every market in the table below.
Pull live prices from nine markets
The first test is simple: can the same client retrieve the latest traded price across every market?
Here is the REST client used throughout the article:
import requests

BASE_URL = "https://data.infoway.io"
HEADERS = {"apiKey": API_KEY, "Accept": "application/json"}

def _unwrap(resp):
    resp.raise_for_status()
    payload = resp.json()
    if payload.get("ret") != 200:
        raise RuntimeError(f"Infoway API error {payload.get('ret')}: {payload.get('msg')}")
    return payload["data"]

def infoway_get(path: str, params: dict | None = None) -> dict:
    return _unwrap(requests.get(f"{BASE_URL}{path}", headers=HEADERS, params=params, timeout=10))

def infoway_post(path: str, body: dict) -> dict:
    return _unwrap(requests.post(f"{BASE_URL}{path}", headers=HEADERS, json=body, timeout=10))
Authentication uses a single apiKey header. Responses also follow the same envelope: ret for status, msg for the message, traceId for tracing, and data for the result. The helper above checks the first two and returns data.
The question is whether that same client works across all nine markets.
MARKET_SAMPLES = {
    "US Stocks":            ("stock",  "TSLA.US,AAPL.US"),
    "China A-Shares":       ("stock",  "600519.SH,000001.SZ"),
    "Hong Kong Stocks":     ("stock",  "00700.HK,09988.HK"),
    "Japan Stocks":         ("japan",  "7203.JP,6758.JP"),
    "South Korea Stocks":   ("korea",  "005930.KS,000660.KS"),
    "India Stocks":         ("india",  "RELIANCE.IN,INFY.IN"),
    "Forex":                ("common", "EURUSD,USDJPY"),
    "Futures/Commodities":  ("common", "XAUUSD,CL.FUT"),
    "Crypto":               ("crypto", "BTCUSDT,ETHUSDT"),
}

rows = []
for label, (business, codes) in MARKET_SAMPLES.items():
    for item in infoway_get(f"/{business}/batch_trade/{codes}"):
        rows.append({"market": label, "symbol": item["s"], "price": item["p"],
                     "volume": item["v"], "timestamp": item["t"]})

df_trades = pd.DataFrame(rows)
Only the endpoint category and symbols change between markets. The returned fields remain consistent: s for symbol, p for price, v for volume, and t for the timestamp in milliseconds.
All nine markets returned data successfully.
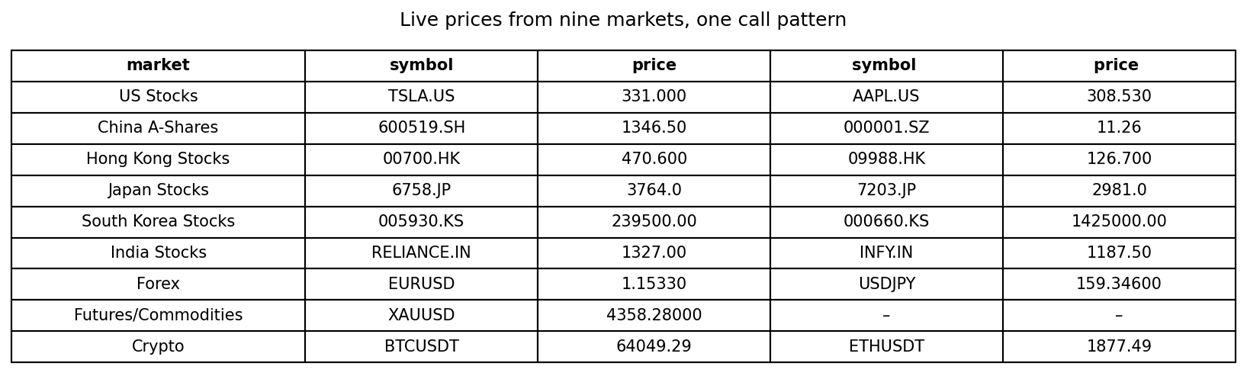
Equity symbols use exchange suffixes such as .SH and .SZ for China, .HK for Hong Kong, .JP for Japan, and .KS for South Korea.
The last traded price tells us what just happened. The order book shows what is waiting to happen next.
Read the order book
The order book shows the prices and volumes currently waiting to trade. The highest bid is the best price available to a seller, the lowest ask is the best price available to a buyer, and the gap between them is the spread.
For BTCUSDT, the endpoint is a single call:
depth = infoway_get("/crypto/batch_depth/BTCUSDT")Trimmed to three levels, the response looks like this:
[{'s': 'BTCUSDT', 't': 1786454834539,
  'a': [['64181.72', '64181.73', '64181.74'],
        ['6.44259',  '0.00066',  '0.00016']],
  'b': [['64181.71', '64181.70', '64181.69'],
        ['11.42786', '0.00073', '0.00016']]}]
a contains the ask side and b the bid side. Each holds prices first, followed by the volume available at those prices. The full response contains ten levels per side.
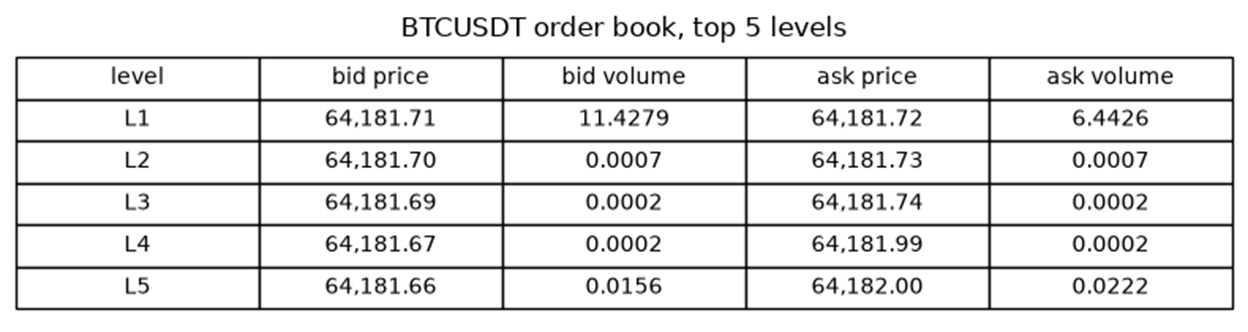
The spread here is only one cent, but the depth reveals what the spread cannot: most of the available volume sits at the top level on both sides.
The dashboard itself only needs the latest price and a historical baseline, so the next step is to retrieve the candles.
Pull the historical candles
The alert needs a baseline, so I use the close from the latest completed daily candle. I also pulled 90 daily candles for TSLA and AAPL to check the historical endpoint.
frames = {}
for symbol in ["TSLA.US", "AAPL.US"]:
    result = infoway_post("/stock/v2/batch_kline", {"klineType": 8, "klineNum": 90, "codes": symbol})
    frame = pd.DataFrame(result[0]["respList"])
    frame["t"] = pd.to_datetime(frame["t"].astype(int), unit="s")
    for col in ["o", "h", "l", "c", "v"]:
        frame[col] = frame[col].astype(float)
    frames[symbol] = frame.sort_values("t")
My first attempt sent both symbols in a single request. It returned only two candles per symbol, with no error and no indication that the response was incomplete. The limit is documented; I had simply missed it. Requesting one symbol at a time returned the full 90 candles.
First thing I learned is that a silent truncation costs more than errors. Errors make the problem visible; partial responses can look correct and send debugging in the wrong direction.
The response also requires two small conversions. Timestamps arrive in seconds here, while the trade endpoint uses milliseconds, and prices arrive as text rather than as numbers.
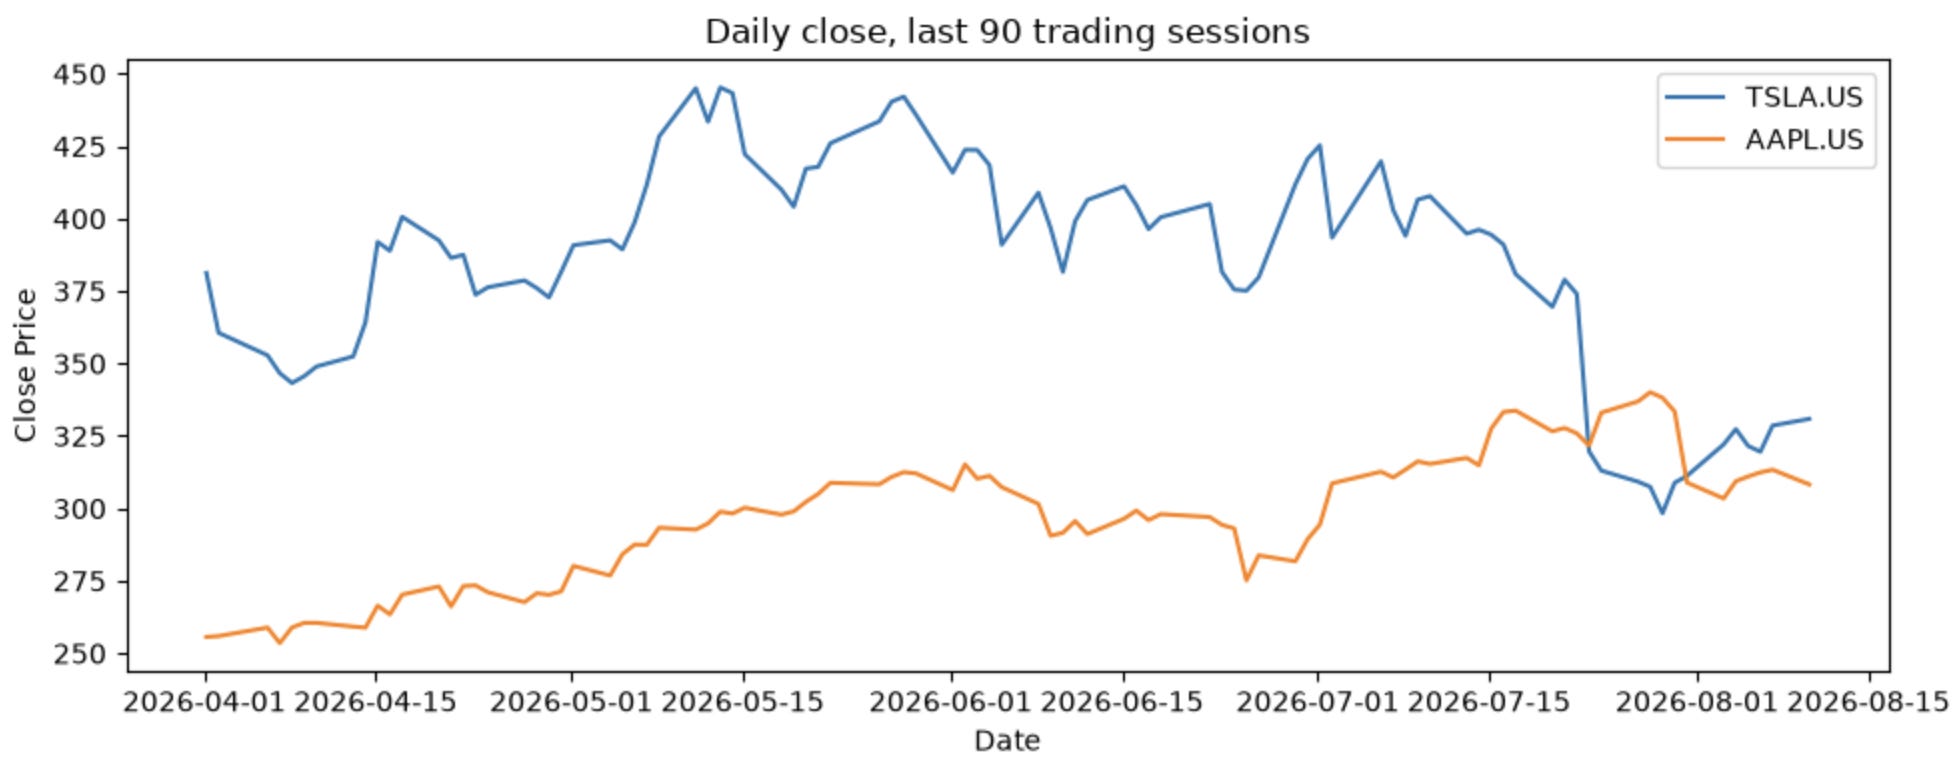
At 600 requests a minute, looping a few hundred symbols one at a time is nothing.
That’s the past covered. Live prices arrive via a different interface.
Stream one channel
The historical candles give us the baseline. Now the dashboard needs prices as they move.
Polling would mean repeatedly calling the REST API for each symbol. Across nine markets, checking each one every second would quickly hit the rate limit. Streaming is a better fit: subscribe once, then receive trades as they happen.
Infoway uses the same WebSocket URL across markets, with the business parameter distinguishing stock, crypto, common, Japan, India, and Korea. For the first test, I subscribed only to BTCUSDT.
async def read_json(ws, timeout):
    """Read one WS message; returns None on timeout or a malformed frame."""
    try:
        return json.loads(await asyncio.wait_for(ws.recv(), timeout=timeout))
    except (asyncio.TimeoutError, json.JSONDecodeError):
        return None

async def stream_demo(max_messages: int = 15, timeout_sec: int = 30):
    received = []
    async with websockets.connect(WS_URL) as ws:
        await ws.send(json.dumps({"code": 10000, "trace": str(uuid.uuid4()), "data": {"codes": "BTCUSDT"}}))
        await ws.send(json.dumps({"code": 10006, "trace": str(uuid.uuid4()),
                                  "data": {"arr": [{"type": 1, "codes": "BTCUSDT"}]}}))
        start = time.time()
        while len(received) < max_messages and (time.time() - start) < timeout_sec:
            msg = await read_json(ws, timeout=5)
            if not msg:
                continue
            received.append(msg)
            print(f"[{LABELS.get(msg.get('code'), msg.get('code'))}] {msg.get('data')}")
    return received
Trades and candles use separate subscriptions on the same connection, which is why there are two send calls. read_json keeps the stream running through timeouts or malformed frames instead of stopping the loop.
The connection acknowledged both subscriptions and started returning trades within a second:
[CONNECTED] None
[SUB_ACK(trade)] None
[SUB_ACK(kline)] None
[TRADE] {'p': '65102.26', 's': 'BTCUSDT', 't': 1786282257136, 'td': 2, 'v': '0.00173'}
[TRADE] {'p': '65102.26', 's': 'BTCUSDT', 't': 1786282257136, 'td': 2, 'v': '0.00173'}
[TRADE] {'p': '65102.27', 's': 'BTCUSDT', 't': 1786282257471, 'td': 1, 'v': '0.0028'}
[TRADE] {'p': '65102.27', 's': 'BTCUSDT', 't': 1786282257471, 'td': 1, 'v': '0.0028'}
One channel works. Next, I test whether the same pattern holds across the six channel types covering all nine markets.
Build the dashboard
With the historical baseline and one streaming channel working, the final step is to put them together: load the baseline, verify each channel, then stream them concurrently and fire alerts.
Pull the baseline
Each alert compares the live price with the previous completed daily close. For every symbol, I fetch the last two daily candles and keep the earlier close as the reference point.
BASELINE_SYMBOLS = {
    "stock":  [("TSLA.US", "US Stocks"), ("00700.HK", "Hong Kong"), ("600519.SH", "China A-Shares")],
    "japan":  [("6758.JP", "Japan"), ("7203.JP", "Japan")],
    "korea":  [("005930.KS", "South Korea"), ("000660.KS", "South Korea")],
    "india":  [("RELIANCE.IN", "India"), ("INFY.IN", "India")],
    "common": [("EURUSD", "Forex"), ("XAUUSD", "Futures/Commodities")],
    "crypto": [("BTCUSDT", "Crypto"), ("ETHUSDT", "Crypto"), ("SOLUSDT", "Crypto")],
}

baseline = {}
for business, entries in BASELINE_SYMBOLS.items():
    for symbol, market in entries:
        result = infoway_post(f"/{business}/v2/batch_kline",
                              {"klineType": 8, "klineNum": 2, "codes": symbol})
        baseline[symbol] = {"market": market, "business": business,
                            "prev_close": float(result[0]["respList"][0]["c"])}
That gives the streaming code a dictionary for symbol lookup.
Verify every channel
Before opening everything at once, I tested one symbol from each of the six channel types.
async def prove_channel(business: str, symbol: str, timeout_sec: int = 8) -> dict:
    url = f"wss://data.infoway.io/ws?business={business}&apikey={API_KEY}"
    start = time.time()
    subscribed_in, live_price = None, None
    try:
        async with websockets.connect(url) as ws:
            await ws.send(json.dumps({"code": 10000, "trace": str(uuid.uuid4()),
                                      "data": {"codes": symbol}}))
            while time.time() - start < timeout_sec:
                msg = await read_json(ws, timeout=timeout_sec - (time.time() - start))
                if not msg:
                    continue
                if msg.get("code") == 10001 and subscribed_in is None:
                    subscribed_in = round(time.time() - start, 2)
                elif msg.get("code") == 10002:
                    live_price = msg["data"]["p"]
                    break
    except Exception:
        pass
    status = "SUBSCRIBED + LIVE TICK" if live_price else (
             "SUBSCRIBED" if subscribed_in is not None else "FAILED")
    return {"business": business, "symbol": symbol, "status": status,
            "subscribed_in_s": subscribed_in, "live_price": live_price}

PROOF_TARGETS = [
    ("stock", "TSLA.US"), ("crypto", "BTCUSDT"), ("common", "EURUSD"),
    ("japan", "6758.JP"), ("india", "RELIANCE.IN"), ("korea", "005930.KS"),
The test separates two signals: a subscription acknowledgement means the channel accepted the request, while a live tick confirms that trades are actually arriving.
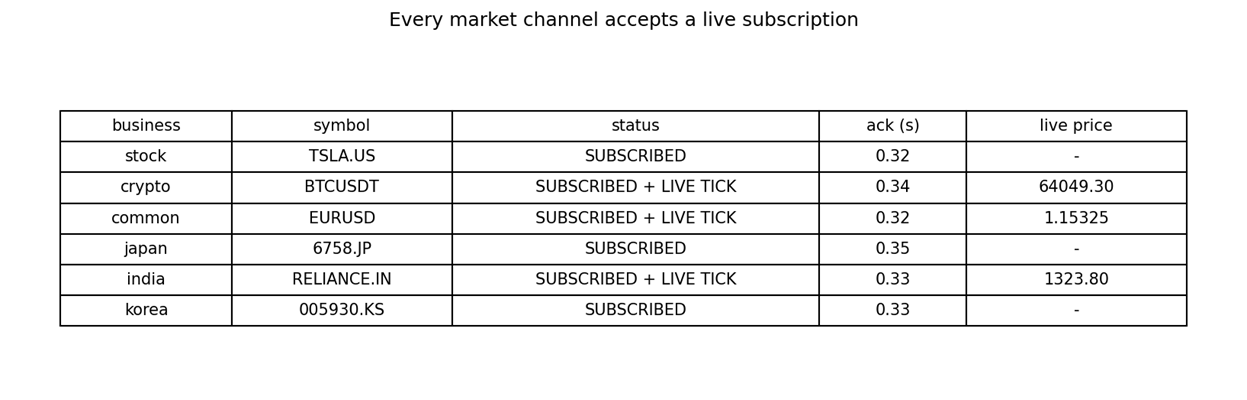
All six channels acknowledged the subscription within half a second. The three markets trading at the time also returned live prices. Japan, Korea, and India were not producing trades, but their channels acknowledged just as quickly as the others.
The second thing I learned: a channel can be verified without waiting for a trade. A subscription acknowledgement already confirms that the connection works and the request was accepted, even when the market is closed and no prices are moving.
Stream all six channels at once
The previous test opened each connection separately. The dashboard needs all six running at the same time.
CHANNELS = {
    "stock":  {"symbols": "TSLA.US,00700.HK",        "label": "Stocks (US + HK)"},
    "crypto": {"symbols": "BTCUSDT,ETHUSDT,SOLUSDT", "label": "Crypto"},
    "common": {"symbols": "EURUSD,XAUUSD",           "label": "Forex + Futures/Commodities"},
    "japan":  {"symbols": "6758.JP,7203.JP",         "label": "Japan"},
    "korea":  {"symbols": "005930.KS,000660.KS",     "label": "South Korea"},
    "india":  {"symbols": "RELIANCE.IN,INFY.IN",     "label": "India"},
}
ALERT_THRESHOLD_PCT = 0.05

async def stream_channel(business: str, symbols: str, label: str, duration: int = 45):
    url = f"wss://data.infoway.io/ws?business={business}&apikey={API_KEY}"
    async with websockets.connect(url) as ws:
        await ws.send(json.dumps({"code": 10000, "trace": str(uuid.uuid4()),
                                  "data": {"codes": symbols}}))
        start = time.time()
        while time.time() - start < duration:
            msg = await read_json(ws, timeout=5)
            if not msg or msg.get("code") != 10002:
                continue
            d = msg["data"]
            sym, price = d["s"], float(d["p"])
            tick = {"market": label, "symbol": sym, "price": price,
                    "ts": d["t"], "recv_s": time.time()}
            base = baseline.get(sym)
            if base:
                tick["move_pct"] = round((price - base["prev_close"]) / base["prev_close"] * 100, 4)
                is_alert = abs(tick["move_pct"]) >= ALERT_THRESHOLD_PCT
                if is_alert and not alert_state.get(sym, False):
                    alerts.append(tick)
                alert_state[sym] = is_alert
            tape.append(tick)

async def run_dashboard(duration: int = 45):
    names = list(CHANNELS)
    results = await asyncio.gather(*[
        stream_channel(biz, CHANNELS[biz]["symbols"], CHANNELS[biz]["label"], duration)
        for biz in names
    ], return_exceptions=True)
    for biz, r in zip(names, results):
        if isinstance(r, Exception):
            print(f"  channel {biz} dropped: {type(r).__name__}: {r}")
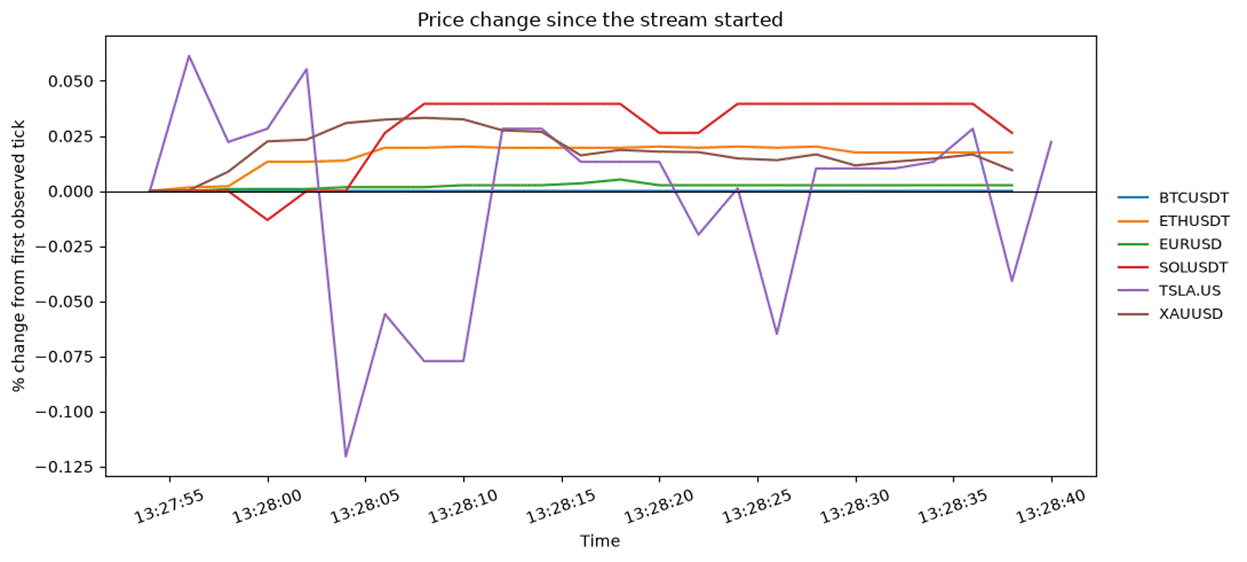
asyncio.gather() keeps the six connections alive concurrently, while each incoming trade is compared with its stored baseline. In my 45-second test, the open markets produced 1,608 ticks across six symbols.
alert_state prevents the same movement from generating an alert on every subsequent trade. An alert fires when a symbol crosses the threshold, then waits until it falls back below before it can trigger again.
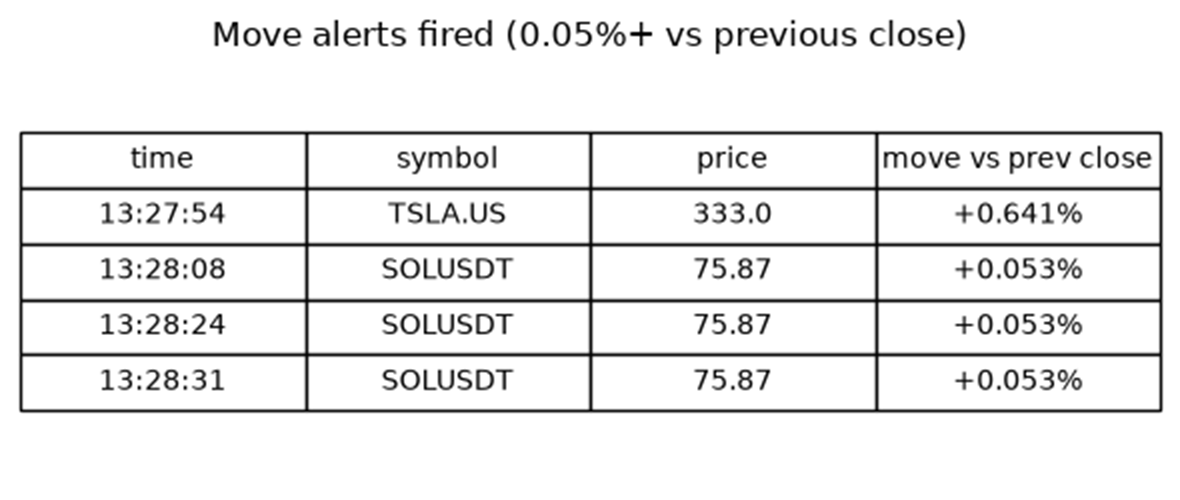
SOLUSDT crossed that boundary three times because its movement sat almost exactly on the threshold.
There was one more problem in the stream: a few trade messages carried timestamps years into the future. The prices in those messages looked normal, but a single bad timestamp was enough to distort the entire time axis.
The third thing I learned: don’t rely on a remote timestamp for the chart. I record when each tick arrives locally and use that receipt time instead.
Conclusion
Would I use it? Yes. The main value is having one integration instead of several, with the same REST client and streaming pattern working across every market I tested.
I am not a market data specialist, so I would treat this as a practical integration test rather than a verdict on market-data quality. The three lessons are what I would carry into the next provider evaluation:
Silent truncation costs more than errors. Errors make the problem visible; partial responses can look correct and send debugging in the wrong direction.
A streaming channel can be verified without waiting for a trade. A subscription acknowledgement already tells us that the connection works and the request was accepted, even when the market is closed.
Don’t rely on remote timestamps for the chart. Record when each tick arrives locally and use that receipt time instead.
Those checks are small, but they reveal much more than a successful API call alone.