4 Pandas Function to Reshape Table Layout
Transform your Pandas Table to your need
Transform your Pandas Table to your need
While working with data, there is a time when you need to transform your table in the way you need it. It might because you need to see your data more clearly, or you need to transform your data into a better form.
In any case, this article would highlight four different functions you could use in order to transform your Pandas Data Frame. Let’s just get into it.
1.sort_values
Simple yet useful. This elegant method is one of the most useful in Pandas arsenal. Just from the name, you could guess what the function does. Yes, this function sorts our table based on the value in specific columns.
Let me show you by using a dataset example.
import pandas as pdimport seaborn as sns#Loading dataset exampletips = sns.load_dataset('tips')tips.head()Above is our dataset example. Let’s say I want to reshape my table layout based on the sorted total_bill column. I could do it with the following code.
tips.sort_values('total_bill').head()Just like that, we have our table sorted in ascending way based on the total_bill column. How about if you want to sort the column based on the size column and then tip column in descending way? You could do that as well with the following code.
#We put our columns in the list and input False value in the ascending parameter to change the sorting directiontips.sort_values(['size', 'tip'], ascending = False).head()Now we have our table sorted by the size column first then continued by the tip column in a descending way.
2.pivot
Pivot is a method from Data Frame to reshape data (produce a “pivot” table) based on column values. it uses unique values from specified index/columns to form axes of the resulting DataFrame.
Another name for what we do with Pivot is long to wide table. To show you why is that, let’s try it with the tips dataset.
#I specify the as the column and the both total_bill and tip column as the valuetips.pivot(columns = 'sex', values = ['total_bill', 'tip'])As you could see, we change the table layout as a pivot table now. The previous class in the sex column now become their respective columns and the values filled by the numerical value in their position.
NaN values present because there are no values present in that row in the original data. For example, index 0 contains NaN in the Male column; this happens because in row index 0 the sex value is Female. Just look at the picture below.
3.pivot_table
There is a method in the Pandas Data Frame object. What is the difference compared to the pivot method? Let’s just try it.
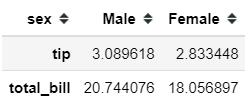
tips.pivot_table(columns = 'sex', values = ['total_bill', 'tip'])Now, the result is significantly different compared to the pivot method. This is because in the pivot_table function what we get is not a row with each data values but instead what we get is the aggregated values.
By default, the aggregation function is the mean (average); that is why in the pivot table above, the values are the mean of each combination.
We could try to have another several aggregation functions in our pivot table.
tips.pivot_table(columns = 'sex', values = ['total_bill', 'tip'], aggfunc = ['mean', 'std', 'median'])In our pivot table above, we add another aggregation function other than mean; Standard Deviation and Median. It creates an additional multi-level pivot table with all the values for the aggregation function.
If you want to create an even detailed separation and the summary values, we could do it with the following code.
#Specificed the size column as the index and margins as True to get the total summarytips.pivot_table(columns = 'sex', values = ['total_bill', 'tip'], aggfunc = ['mean', 'std', 'median'], index = 'size', margins = True)Above we get the detailed pivot table that we need.
4.Melt
Melt is a reverse of pivot function. In this function, we create a wide to long table. Or in other words, we unpivot the table. Let’s just try it to give a feeling of what the function does.
tips.melt(id_vars = 'tip', value_vars = 'sex')Just like that, we get the melt table. In the unpivoted table above, we get three columns; tip, variable, and value column. The tips column is the original value of the tip column, the variable column value is the original column name, and the value column values are the class category or the value from the variable column value.
Conclusion
In this article, I have shown you four Pandas function to reshape the table layout:
sort_values
pivot
pivot_table
melt
I hope it helps!


