7 Pandas Tips to Step Up Your Data Game
Improve your data workflow with these steps
Pandas is a Python package used for data manipulation and has been a staple for many data scientists. There are many alternatives, but Pandas is still our go-to when performing any data activity in Python.
With how vital Pandas is for our data work, it’s always good to learn some tips to improve our workflow. There are many tips that I want to share with you to step up your Pandas game.
What are these? Let’s get into it.
Tips 1: Using Pandas' Options and Settings
When you are working with Pandas, there are times when the default display of the Pandas DataFrame is not suitable for your work. That’s why there are options for you to change it up.
The process is always set up using the pd.set_options and we passed the eligible options.
Here are some examples you can do:
Setting up the table row and columns display
# Setting the maximum number of rows and columns to display
pd.set_option('display.max_rows', 50)
pd.set_option('display.max_columns', None)
The code above would display all the available columns in the table while displaying a maximum of 50 rows.
Floating point precision
pd.set_option('display.precision', 3)The code above controls the maximum float or decimal number to display.
Change missing values representation in Pandas.
pd.set_option('styler.format.na_rep', 'Empty')The option above would change the missing data values representation to your chosen string.
For all the available options, you can visit this documentation.
Tips 2: Using Pandas Replace and Regex for Data Cleaning
You can perform advanced data cleaning in the Pandas using the Replace function. It’s a function where we state what should be replaced and what the replacement would be.
The neat part of the Replace function is that it allows the Regex method. Here is the example code.
For example, here is the original DataFrame.
import pandas as pd

# Sample DataFrame
data = {'text_column': ['123abc', '456def', '789ghi', 'NoNumbers', '1000xyz']}
df = pd.DataFrame(data)

# Display original DataFrame
print("Original DataFrame:")
print(df)
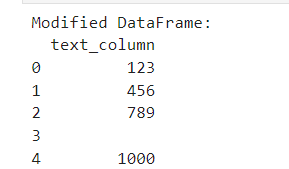
In the next part, we replace all the alphabetical characters with empty strings, which means we remove them.
# Using replace with regex to remove all alphabetical characters
df['text_column'] = df['text_column'].replace({'[A-Za-z]': ''}, regex=True)

# Display modified DataFrame
print("Replace alphabetical character DataFrame:")
print(df)
These advanced cleaning techniques make things easier in your data workflow.
Tips 3: Using query for data selection
Data selection is the most essential activity you would do as a Data Scientist, yet it is one of the most hassles. Sometimes, it is a hassle because of how wordy the condition is. That’s why we could use the query method from the Pandas Data Frame object to make it easier.
Here is an example of using the query method.
# Sample DataFrame
data = {'A': [1, 2, 3, 4, 5], 'B': [10, 20, 30, 40, 50], 'C': ['red', 'blue', 'green', 'yellow', 'black']}
df = pd.DataFrame(data)

# Using .query() to filter data
# Select rows where 'A' is greater than 2 and 'B' is less than 50
filtered_df = df.query('A > 2 & B < 50')

print(filtered_df)
Tips 4: Using Method Chaining with Pipe
Method chaining is a continuous function executed in the same line of code. We use a chain method to decrease the line we write and perform the function faster. Pandas typically encourage the usage of this method.
Here is an example of Method Chaining.
# Sample DataFrame
df = pd.DataFrame({'A': [1, 2, 3, 4, 5], 'B': [10, 20, 30, 40, 50]})

# Define custom functions for transformations
def add_column(df, col_name, value):
    df[col_name] = value
    return df

def multiply_column(df, col_name, factor):
    df[col_name] = df[col_name] * factor
    return df

# Using pipe() for method chaining
result_df = (df
             .pipe(add_column, 'C', 100)
             .pipe(multiply_column, 'A', 10)
             .pipe(multiply_column, 'B', 0.1))

print(result_df)
In the example above, we perform three transformations to our dataframe with the function. Rather than execute it three separate times, we chain them together to make it more neat.
Tips 5: Highlight the DataFrame Information
While presenting your data, we could also use all the information as the primary way to present the data. I often give the data with a background colour to highlight which number is in the lower and higher areas. Let’s use the example by the following code.
import numpy as np

# Sample DataFrame
np.random.seed(0)
df = pd.DataFrame(np.random.rand(5, 3), columns=['A', 'B', 'C'])

# Applying a gradient function style
styled_df = df.style.background_gradient(cmap='Blues')

styled_df
In the code above, we use a gradient to show which values in each column have the highest and lowest values.
Tips 6: Read data from the Web
Sometimes, you find a lot of tables on the Web that you find interesting and want to process. In this case, you can read the HTML table data from the Web. For example, the following code would read all the tables from the Wikipedia page.
import pandas as pd

# URL containing HTML tables
url = 'https://en.wikipedia.org/wiki/List_of_countries_by_GDP_(nominal)'

# Read all tables found in the HTML into a list of DataFrames
tables = pd.read_html(url)
tables[2]
With a few lines of code, all the tables you need are now available in your Jupyter Environment.
Tips 7: Don’t Forget to Check your DataFrame Memory Consumption Regularly
Pandas DataFrame could consume a lot of memory, so removing unnecessary variables is always a good practice, mainly if it uses so much memory. You can use the following code to get information on your DataFrame memory usage.
df.info(memory_usage='deep')The information is at the bottom part. Monitor this to make sure your environment is working well.
Thank you, everyone, for subscribing to my newsletter. If you have something you want me to write or discuss, please comment or directly message me through my social media.


