


Disclosure: This article is sponsored by TickerLayer, which provided reviewer access. The examples and observations are based on my testing.
Market data includes prices, trading volume, and historical observations. We can use it to study market changes or build financial applications, but we also need to understand what each value represents and when it was recorded.
To access this data in Python, we can use an API. One platform that provides this access is TickerLayer, which offers REST APIs for individual requests, WebSocket streams for ongoing updates, and an MCP server for compatible AI clients.
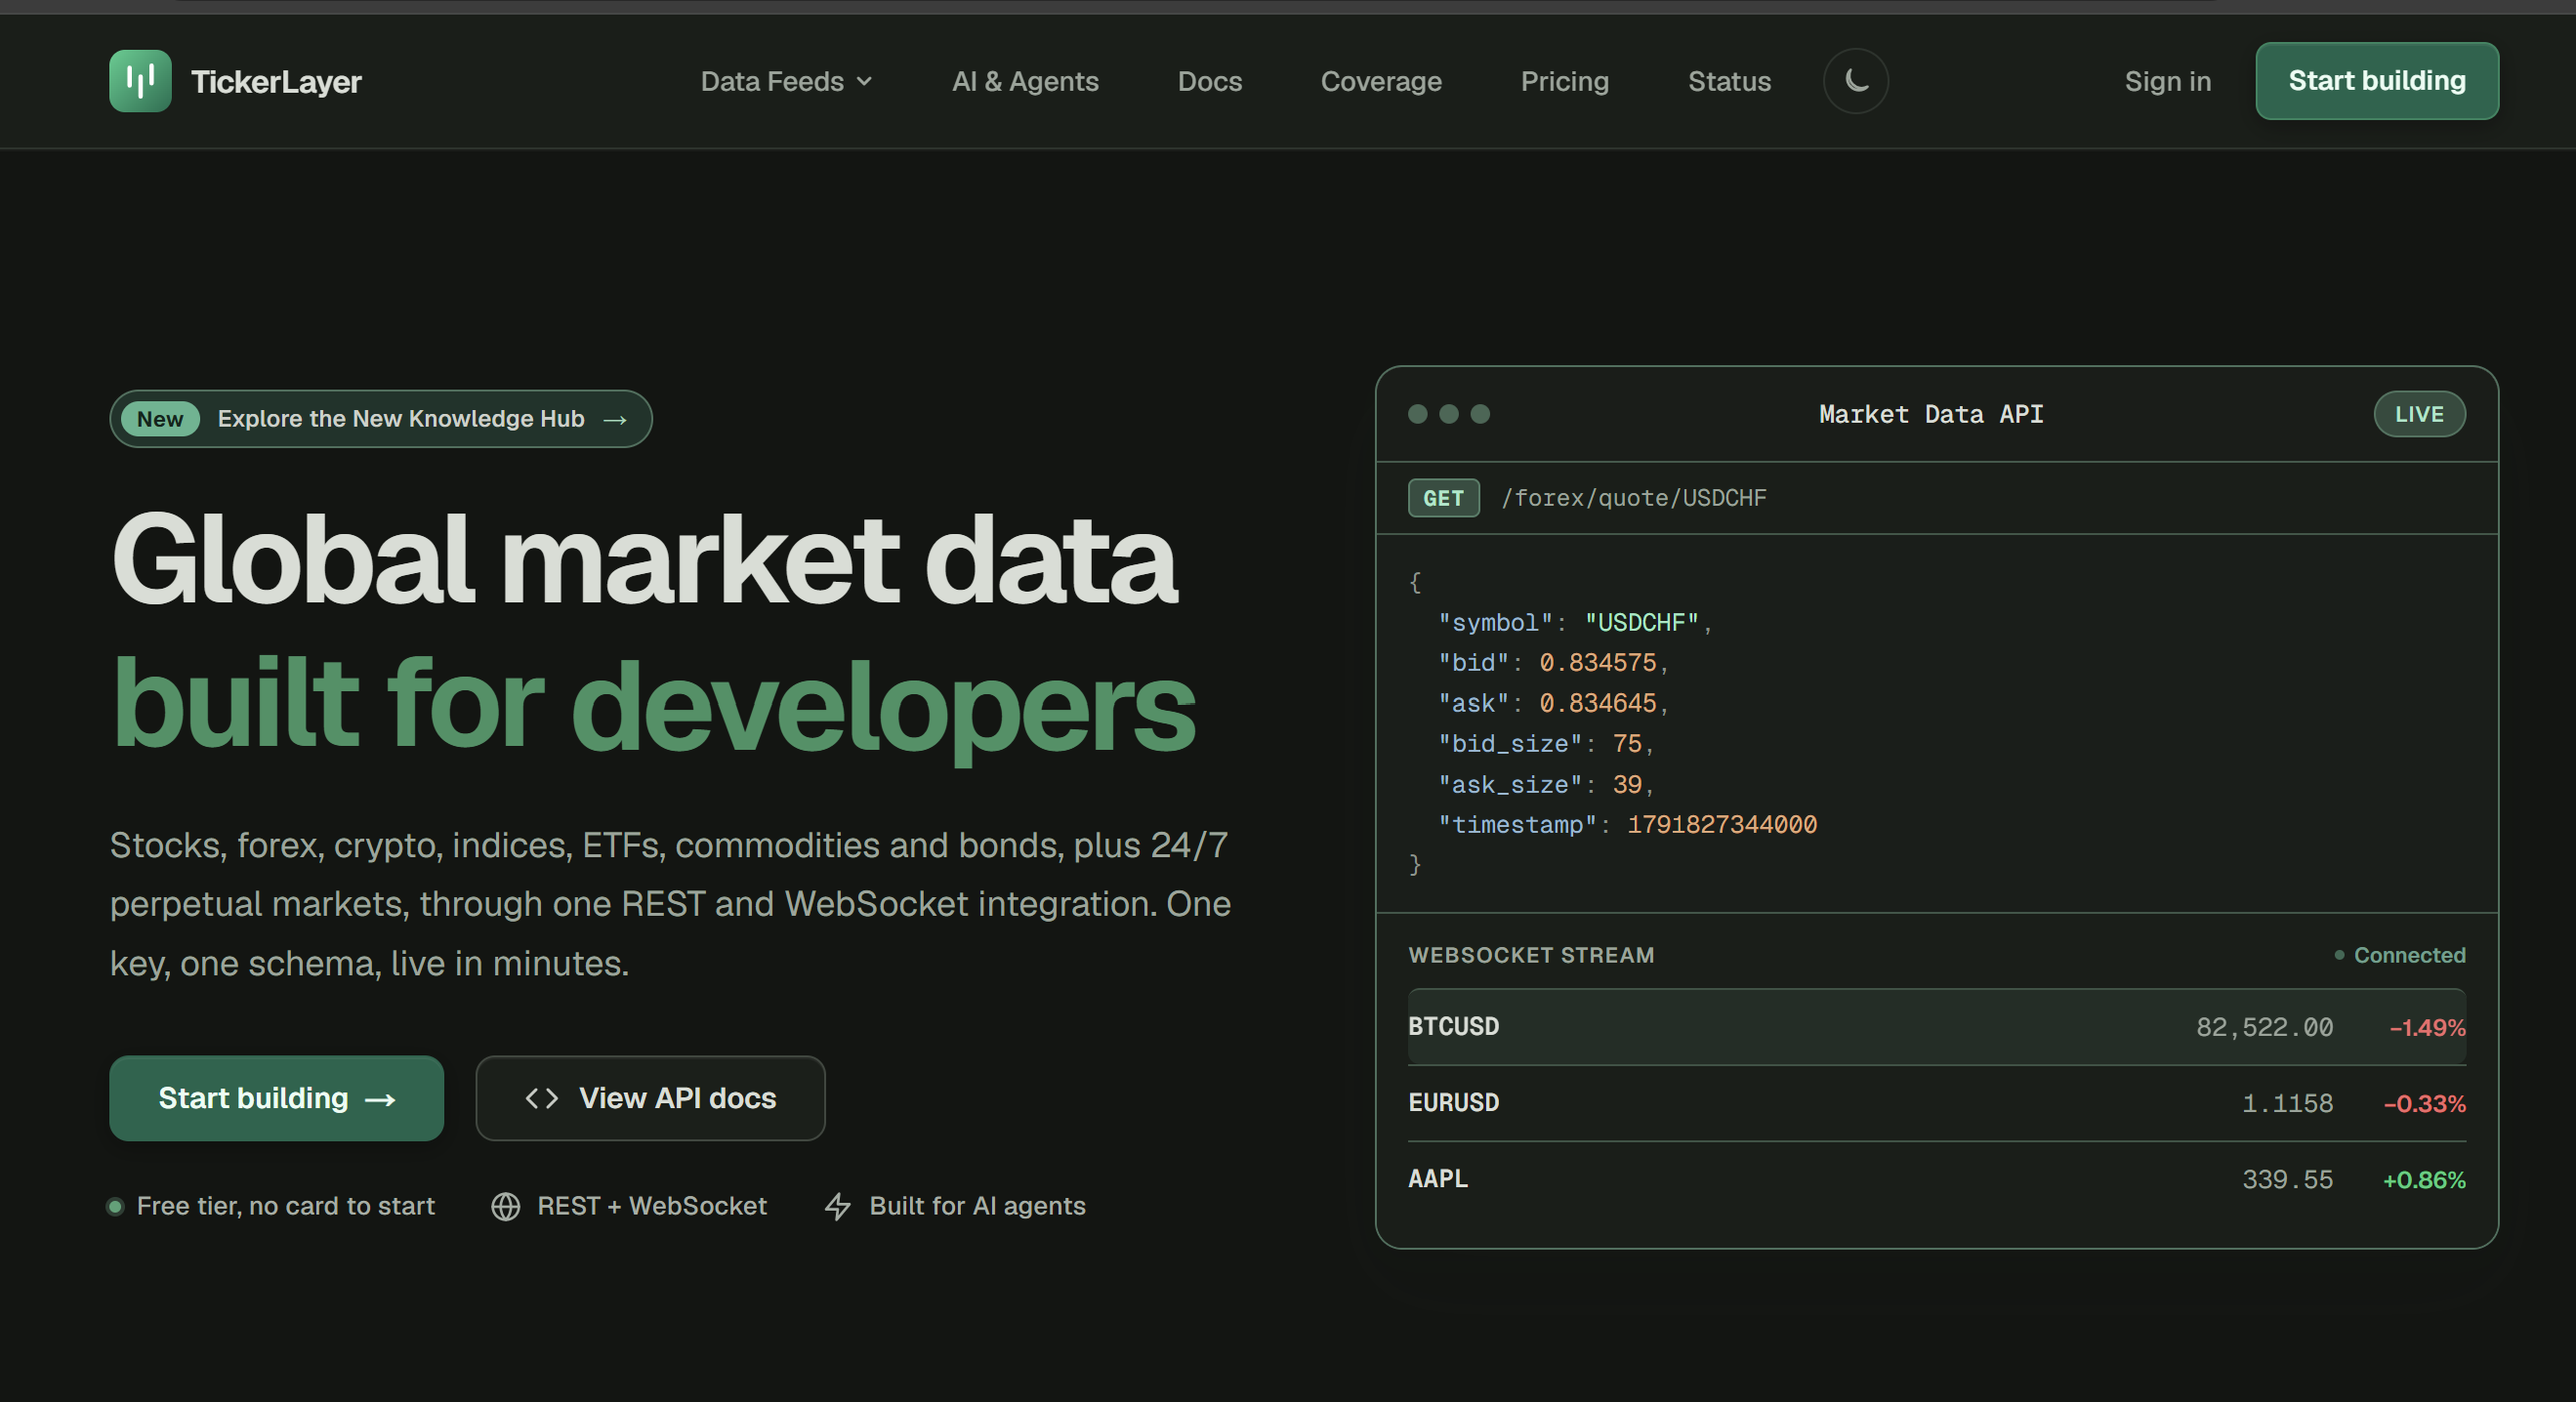
In this tutorial, we will build a small market monitor with Python, then explore streaming and the MCP option. All the code, notebook, and saved responses are in the GitHub repository.
Let’s get into it.
Set Up the Python Environment
First, get an API key from the TickerLayer dashboard by following the quickstart instructions. You will need access to the feeds used below, including an eligible paid plan or approved trial for streaming.
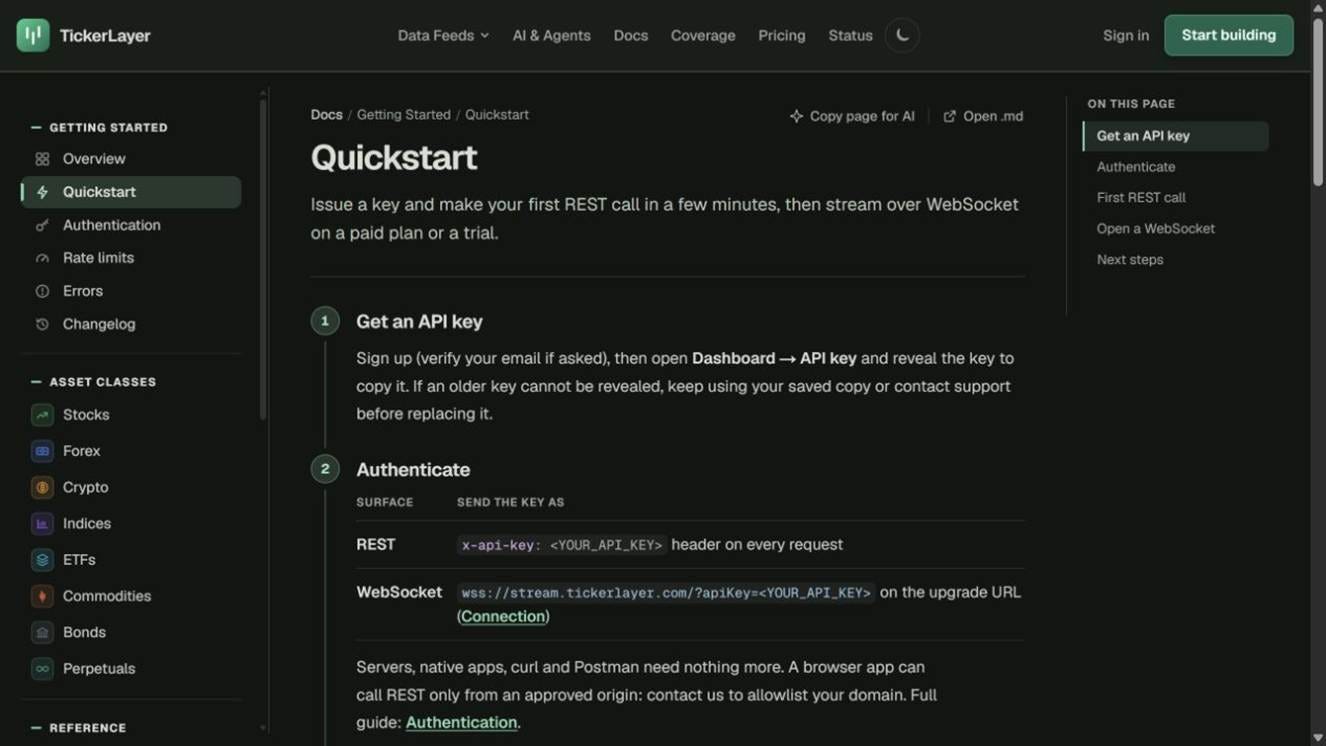
Download the repository to continue the tutorial.
Next, install the packages:
python -m pip install -r requirements-article.txtThe files market_monitor.py and tickerlayer_experiment.py contain the functions used below. Keep them together in the repository folder.
Store your key in an environment variable named TICKERLAYER_API_KEY. For example, in PowerShell:
$env:TICKERLAYER_API_KEY = "YOUR_API_KEY"Replace the placeholder with your key, then create a session using it. Keep the key out of any notebook you share.
import os
import requests
import pandas as pd

from market_monitor import get_json, quote_row, WATCHLIST

key = os.environ[”TICKERLAYER_API_KEY”]
session = requests.Session()
session.headers.update({
 “x-api-key”: key,
 “Accept”: “application/json”,
})
We can now use this session for our requests. The get_json function imported from market_monitor.py returns each response as a Python dictionary.
Build the REST Market Monitor
Let’s start with Bitcoin. We can retrieve its latest bid and ask prices using the BTCUSD symbol:
quote = get_json(session, "/crypto/quote/BTCUSD")
print(quote)
The response gives us the prices and their timestamp. To compare Bitcoin with other instruments, let’s create a function that places each quote into the same table structure:
def quote_row(asset, payload):
    bid, ask = float(payload["bid"]), float(payload["ask"])
    return {
        "asset": asset,
        "symbol": payload["symbol"],
        "bid": bid,
        "ask": ask,
        "mid": (bid + ask) / 2,
        "spread": ask - bid,
        "event_time_utc": pd.to_datetime(
            payload["timestamp"], unit="ms", utc=True
        ),
    }
This function also calculates the midpoint and spread, and converts the timestamp to UTC. We can now apply it to WATCHLIST, which we imported from market_monitor.py:
rows = []
for asset, symbol in WATCHLIST:
    payload = get_json(session, f"/{asset}/quote/{symbol}")
    rows.append(quote_row(asset, payload))

monitor = pd.DataFrame(rows)
print(monitor.to_string(index=False))
The watchlist includes crypto, forex, stocks, indices, ETFs, commodities, and perpetuals. I checked the symbol directories before choosing these examples; stocks, for example, use a country prefix such as US:AAPL.
Displaying the monitor in a notebook gives us the following table:
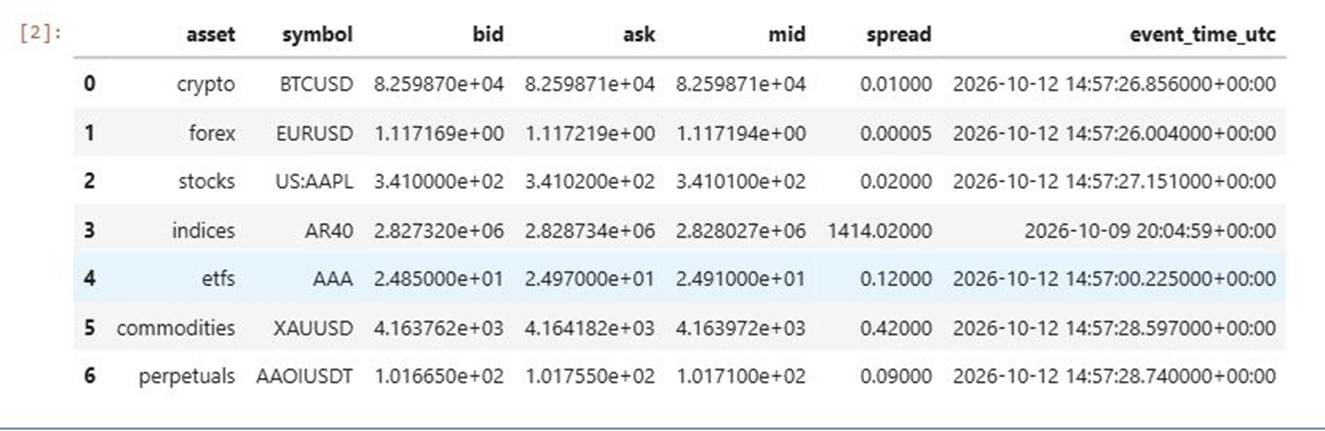
One thing I noticed was the AR40 timestamp. It was about 66.9 hours older than when the response arrived. Let’s check the market status for more context:
status = get_json(
    session, "/markets/status",
    params={"asset": "indices", "symbol": "AR40"},
)
print(status["status"], status["phase"], status["reason"])
The saved status response was:
open primary Generic weekday session (UTC)This response used a generic UTC calendar, not a confirmation that a new AR40 quote had arrived. TickerLayer’s market-status documentation explains that an open session does not guarantee live quotes. The saved responses show the difference, but do not establish why this quote was older.
We can also request government bond yields. Since these are rates, we will keep them separate from the price table. Here is an example for the US ten-year yield:
bond = get_json(session, "/bond/snapshot/US:10Y")
print(bond["rate"], bond["unit"], bond["date"])
print("Change in basis points:", bond["change_bps"])
Keeping the date beside the yield makes its update period clear.
Add Historical Data
To explore how prices change over time, we can retrieve historical data. Let’s request the last seven completed days of Bitcoin OHLCV data, which contains the open, high, low, close, and volume:
from datetime import datetime, timedelta, timezone

today = datetime.now(timezone.utc).date()
start = today - timedelta(days=7)
end = today - timedelta(days=1)

history = get_json(
    session,
    f"/crypto/agg/BTCUSD/1/day/{start}/{end}",
    params={"sort": "asc", "limit": 10},
)
bars = pd.DataFrame(history["results"])
bars["date"] = pd.to_datetime(bars["t"], unit="ms", utc=True)
print(bars[["date", "o", "h", "l", "c", "v"]])
print("Bars returned:", len(bars))
print("Next page:", history.get("next_offset"))
The result table is shown in the table below:
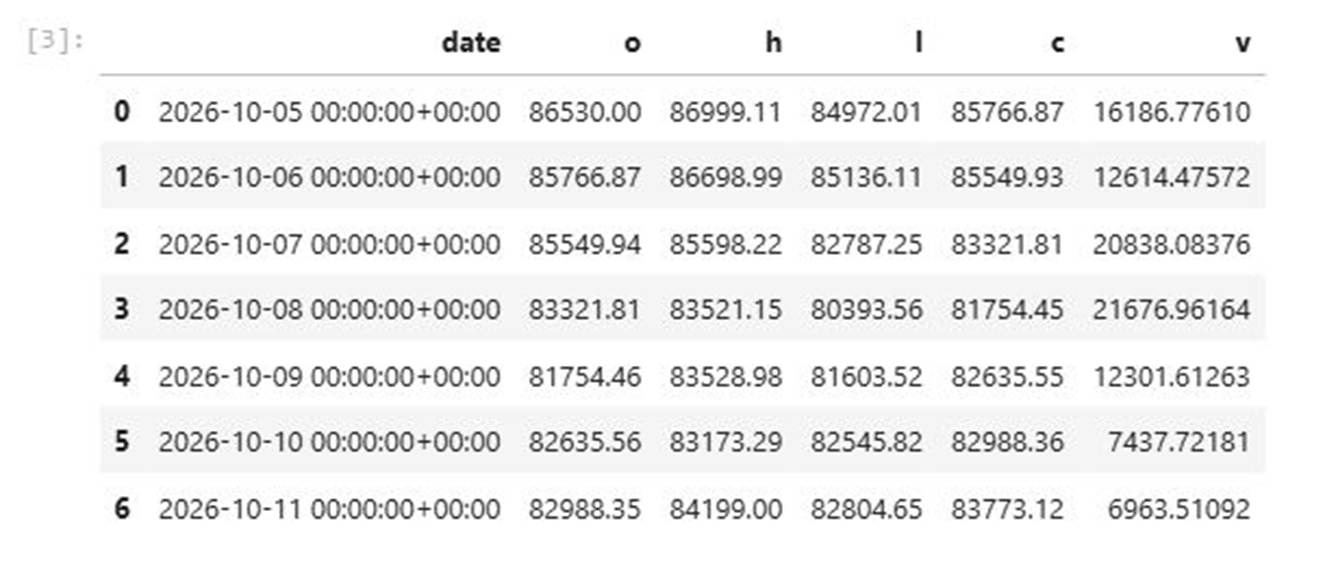
For a longer date range, check next_offset for another page of results. The crypto REST reference covers the query parameters.
Receive Updates Through WebSocket
For ongoing price updates, we can use a WebSocket connection. We will subscribe to Bitcoin quotes and trades through the crypto.quotes and crypto.trades channels.
TickerLayer’s subscription guide shows this request format and acknowledgement.
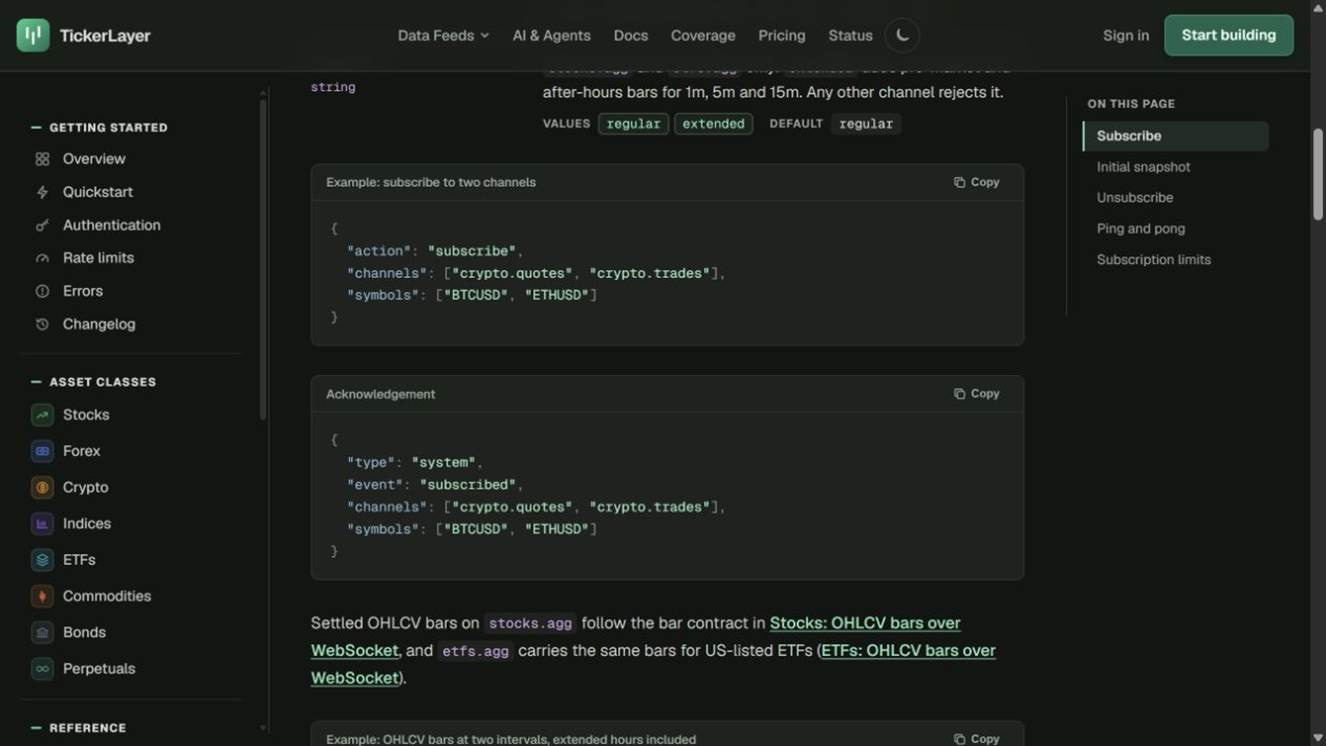
For our Bitcoin example, the stream_events function in market_monitor.py opens the connection and sends the following subscription:
subscription = {
    "action": "subscribe",
    "channels": ["crypto.quotes", "crypto.trades"],
    "symbols": ["BTCUSD"],
    "snapshot": True,
}
The snapshot option requests a recent value on subscription when one is available. Our helper then collects up to 80 messages or listens for 15 seconds, whichever comes first.
Let’s use the received messages to update our monitor:
import asyncio
from market_monitor import stream_events, apply_event

stream = asyncio.run(stream_events(key, seconds=15))
state = {}
for event in stream["events"]:
    apply_event(state, event["message"])

print(state[("crypto", "BTCUSD")])
If you are running this in a notebook with an active event loop, use stream = await stream_events(key, seconds=15) instead of asyncio.run.
We can also inspect the first quote message directly:
import json

quote_event = next(
    event["message"] for event in stream["events"]
    if event["message"].get("type") == "quote"
)
print(json.dumps(quote_event, indent=2))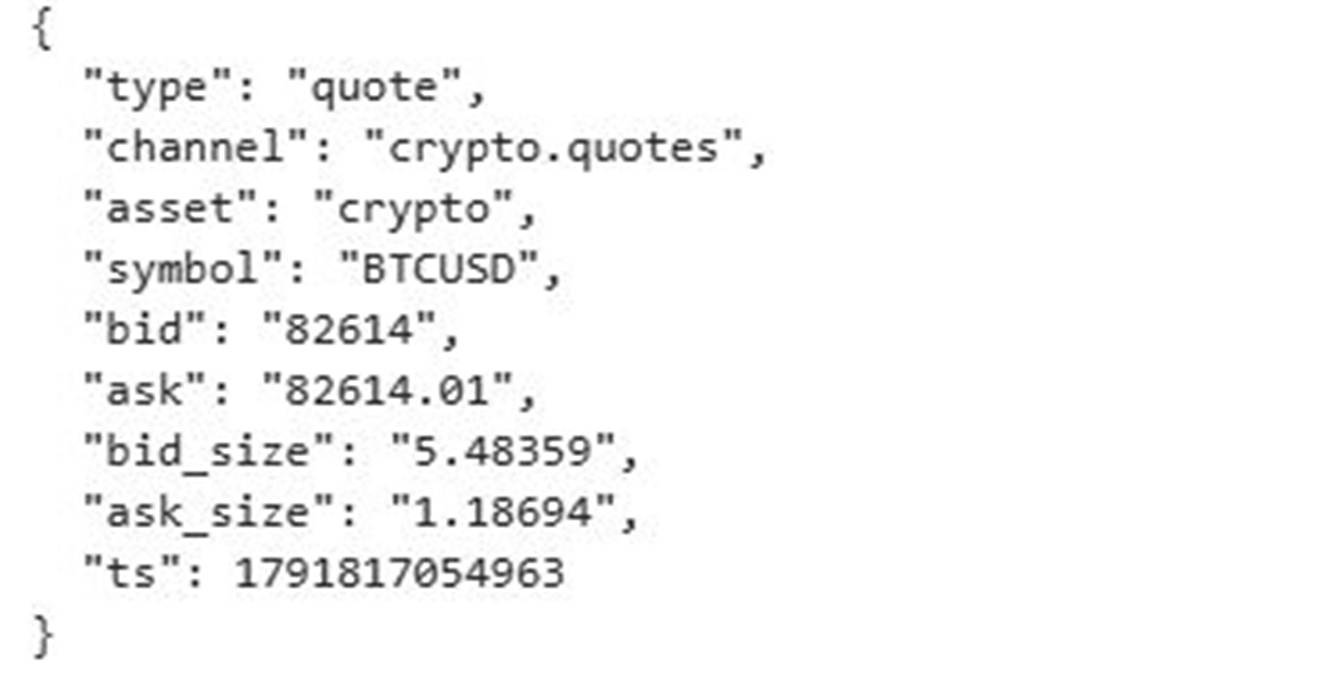
To see the mix of quotes, trades, and system messages in this capture, we can count them by type:
from collections import Counter

message_counts = Counter(
    event["message"].get("type", "unknown")
    for event in stream["events"]
)
print("Messages received:", len(stream["events"]))
print("Message types:", dict(message_counts))
print("Elapsed capture time:", stream["duration_seconds"], "seconds")
After checking how many messages we received and their types, we can use them to update our monitor. The apply_event function handles quotes and trades separately, keeping the latest bid and ask alongside the latest trade price.
Handle Temporary Errors and Reconnect
A request might fail temporarily, even when our code is correct. For a 503 response, the get_json function retries up to three times, waiting 1, 2, and 4 seconds between attempts. It uses the server’s Retry-After value when provided.
If the request still fails, we can handle the HTTP error using the following code:
try:
    latest = get_json(session, "/crypto/quote/BTCUSD")
    print(latest)
except requests.HTTPError as exc:
    print(”Request failed with HTTP status:”, exc.response.status_code)
Other HTTP errors are raised without retrying. For example, a 401 means we need to check our API key, while a 429 means we should check our request limits.
For WebSocket, we need to reconnect if the connection drops. Let’s use stream_with_reconnect from the repository and pass the collected messages into our monitor:
from stream_recovery import stream_with_reconnect

recovered = asyncio.run(stream_with_reconnect(key, seconds=15))
print(”Reconnect attempts:”, recovered[”reconnect_attempts”])

for event in recovered[”events”]:
    apply_event(state, event[”message”])
The function keeps the messages received before the interruption and subscribes again after reconnecting. It allows up to three retries and requests a recent snapshot when available. The capture still has time and message limits.
In a notebook, use recovered = await stream_with_reconnect(key, seconds=15) instead of asyncio.run.
The snapshot helps update our monitor, but it does not restore every trade missed during the interruption. This is useful for our latest-value monitor, not a complete trade history.
Request a Snapshot Through MCP
If we want to access market data through a compatible AI client, TickerLayer also supports the Model Context Protocol, or MCP. It exposes data requests as tools the client can call.
Let’s try the get_snapshot tool from Python. The run_mcp function in tickerlayer_experiment.py connects to the MCP server, lists its tools, and calls get_snapshot with these arguments:
{
  "asset_class": "crypto",
  "symbol": "BTCUSD"
}
Run the function and print the snapshot:
from tickerlayer_experiment import run_mcp

mcp = run_mcp(key)
if mcp["error"]:
    raise RuntimeError(mcp["error"])

print("Tools discovered:", len(mcp["tool_names"]))

call = next(
    step for step in mcp["steps"]
    if step["name"] == "tools_call_get_snapshot"
)
result = call["body"]["result"]
if result.get("isError"):
    raise RuntimeError(result["content"])
print(json.dumps(result["structuredContent"], indent=2))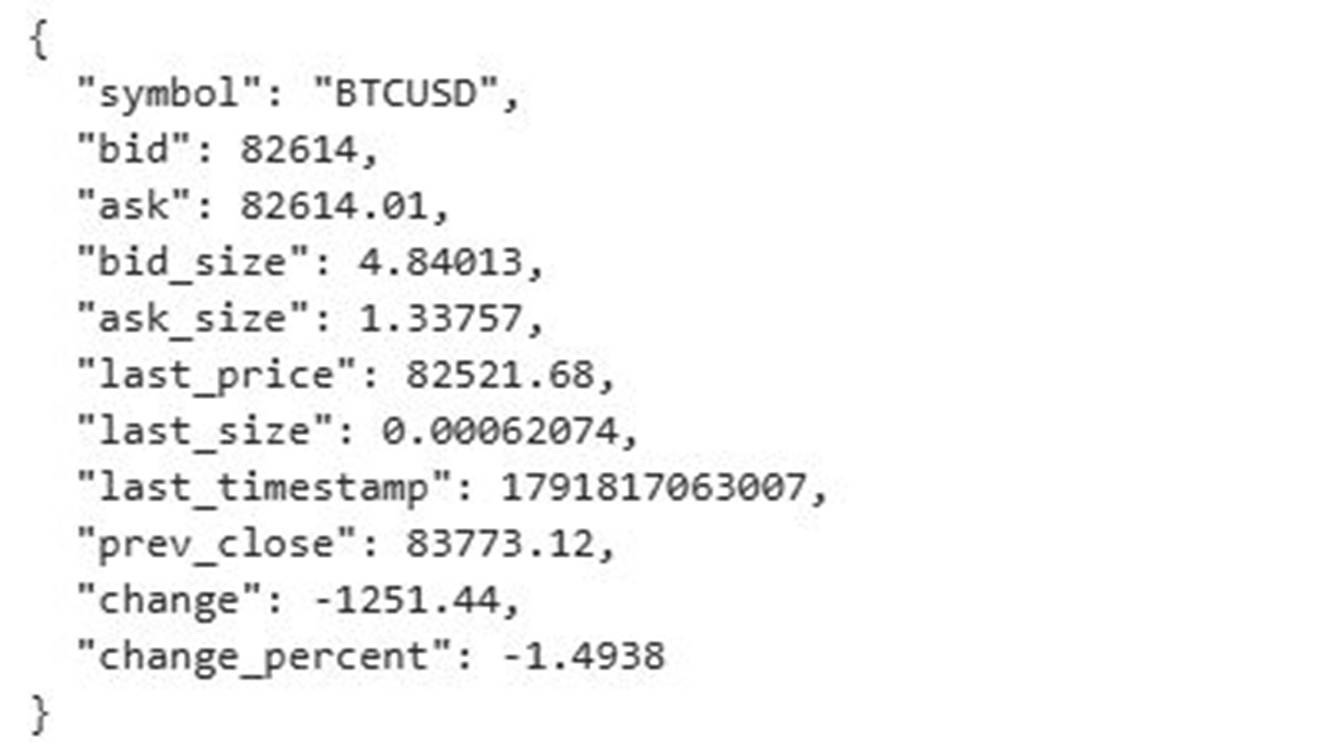
The server listed 12 tools, and the snapshot returned the bid, ask, last trade, previous close, and price change. This gives an AI client structured market data to work with.
What I Would Keep in Mind
TickerLayer returns quotes in a similar format across different markets, making them easy to combine in one table. However, some prices were older than the others. This is why we should check when each price was last updated before using it in our analysis.
I used a reviewer key with elevated access. Before running your own monitor, check your account’s feed access and request limits, especially if you plan to poll frequently.
TickerLayer describes its data as derived and indicative, and perpetual quotes are calculated composites. My short tests checked whether I could retrieve and process the responses; they did not independently verify price accuracy or long-term reliability. Review the market data disclaimer for your intended use. You can inspect the saved responses in the repository’s fresh_results folder.
Run the Complete Example
From the downloaded repository folder, run:
python market_monitor.py --captureThe command saves new responses under fresh_results. Open TickerLayer_Outputs.ipynb and change capture_path to your new JSON file to explore them.
Conclusion
In this article, we explored how to work with TickerLayer in Python, from combining market quotes in a table to retrieving historical prices. We also covered WebSocket updates and MCP integration. These examples provide a starting point for building a market data workflow for our own projects.
If you would like to build a similar project, visit TickerLayer to explore the available market data and get an API key.
You can start with the code in our GitHub repository, then add the stocks, currencies, or other assets you want to follow. From there, try using the results in a research notebook or building a dashboard for your own watchlist.