How to implement ggplot2 in Python
In case you wonder about it
In case you wonder about it
Visualization in R
In the Data Science field, I never affected by the discussion about Python vs R. Why? Because I just use both of them. As simple as that.
I love Python for machine learning capabilities and how versatile it is, but if it is about visualization; R has a special place in my heart.
Let’s take an example by using the ggplot2 package to create a simple but informative plot. I would use the mpg dataset that available internally in the ggplot2 package.
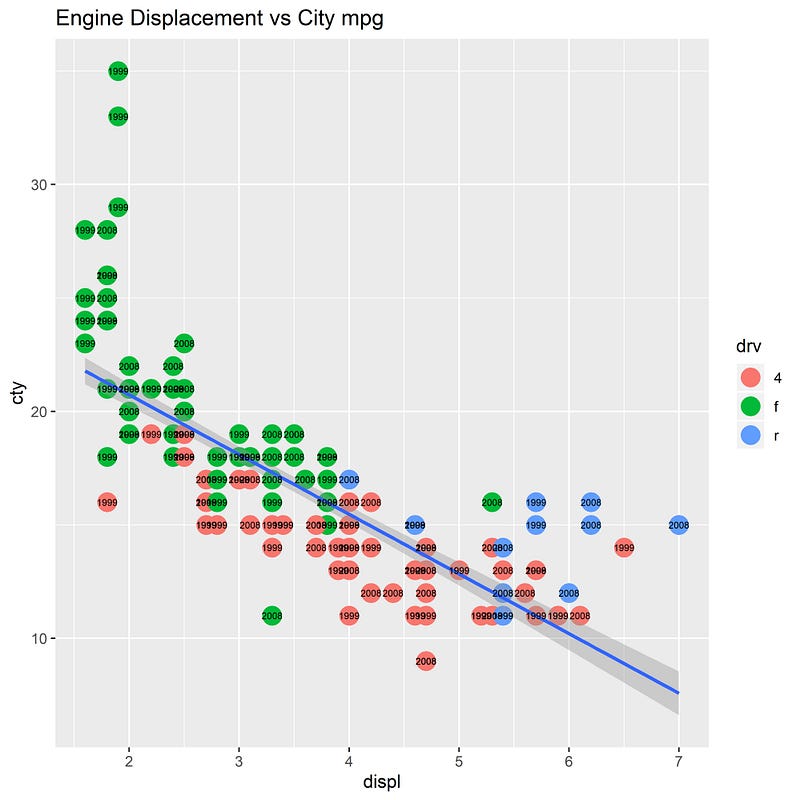
#I would use the mpg dataset that available in the ggplot2 packagelibrary(tidyverse)mpg <- ggplot2::mpghead(mpg)From this dataset, let’s say I want to visualize if there is a relation between displ feature (Engine Displacement in Litre) vs cty feature (City mpg). Then I want to separate it by the drv feature (Drive Wheels) and every point would be annotated by the car year.
#Creating the plotp1 <- ggplot(data = mpg) + geom_point(mapping = aes(x = displ, y = cty, color = drv), shape = 19, size = 5) + geom_smooth(mapping =aes(x = displ, y= cty), method = 'lm') + geom_text(mapping = aes(x =displ, y = cty, label = year), size = 2)+ ggtitle('Engine Displacement vs City mpg')p1This is why I love using the ggplot2 package in R. By typing a few lines, I could produce detailed plot layers with abundant information.
ggplot2 in Python
Then I am thinking, is there any package out there in the Python that equivalent to the ggplot2 R. I actually get the answer for that, there is a module package for visualization purposes that is based on the ggplot2 package. It is called plotnine.
8 Skills You Need to Become a Data Scientist | Data Driven Investor
Numbers do not scare you? There is nothing more satisfying than a beautiful excel sheet? You speak several languages…www.datadriveninvestor.com
Using plotnine is similar to using ggplot2 in R. Just a few tweaks of line here and there would produce a similar plot. Let me give an example with the same mpg dataset.
#In case you have not install the package yetpip install plotnine#Importing the module and any function to be used.import plotnine as pnfrom plotnine import ggplot, geom_point, geom_smooth, geom_text, ggtitle, aes#similar to the ggplot2, plotnine also include few sample dataset. mpg = pn.data.mpgmpg.head()The same dataset, it means we could produce a similar ggplot2 plot via plotnine.
p1 = (ggplot(data = mpg) +geom_point(mapping = aes(x = 'displ', y = 'cty', color = 'drv'), shape = 'o', size = 5) +geom_smooth(mapping =aes(x = 'displ', y= 'cty'), method = 'lm') + geom_text(mapping = aes(x ='displ', y = 'cty', label = 'year'), size = 5)+ ggtitle('Engine Displacement vs City mpg'))Just like that, we obtain almost the same plot if we produce in via the ggplot2 R package. I said almost because the default parameter is a little bit different although it could be easily changed if we need it.
Using plotnine, there is little extra detail we need to add. In plotnine, we need to include extra parentheses before the ggplot function and additional quotation mark in the feature names (If you have use pandas before, it would be really familiar).
Another difference is just the geom_point shape that needs to follow the matplotlib package rule instead of specifying the shape number (previously in my R line, I used shape = 19. Here in Python, I use shape = ‘o’).
That’s it. If you are familiar with R and want to learn Python with the same feeling in R; plotnine is the way to go.
I hope it helps!


