

Learning AI for data science gives us the ability to analyze data, build predictive models, and develop applications with large language models. We can apply these skills to problems such as forecasting demand, understanding customer behavior, and finding information in business documents.
The challenge is deciding where to start and how the subjects connect. SQL and Python help us prepare and explore the data. Statistics helps us interpret the results. Machine learning allows us to make predictions, while large language models give us another way to work with text and build AI applications.
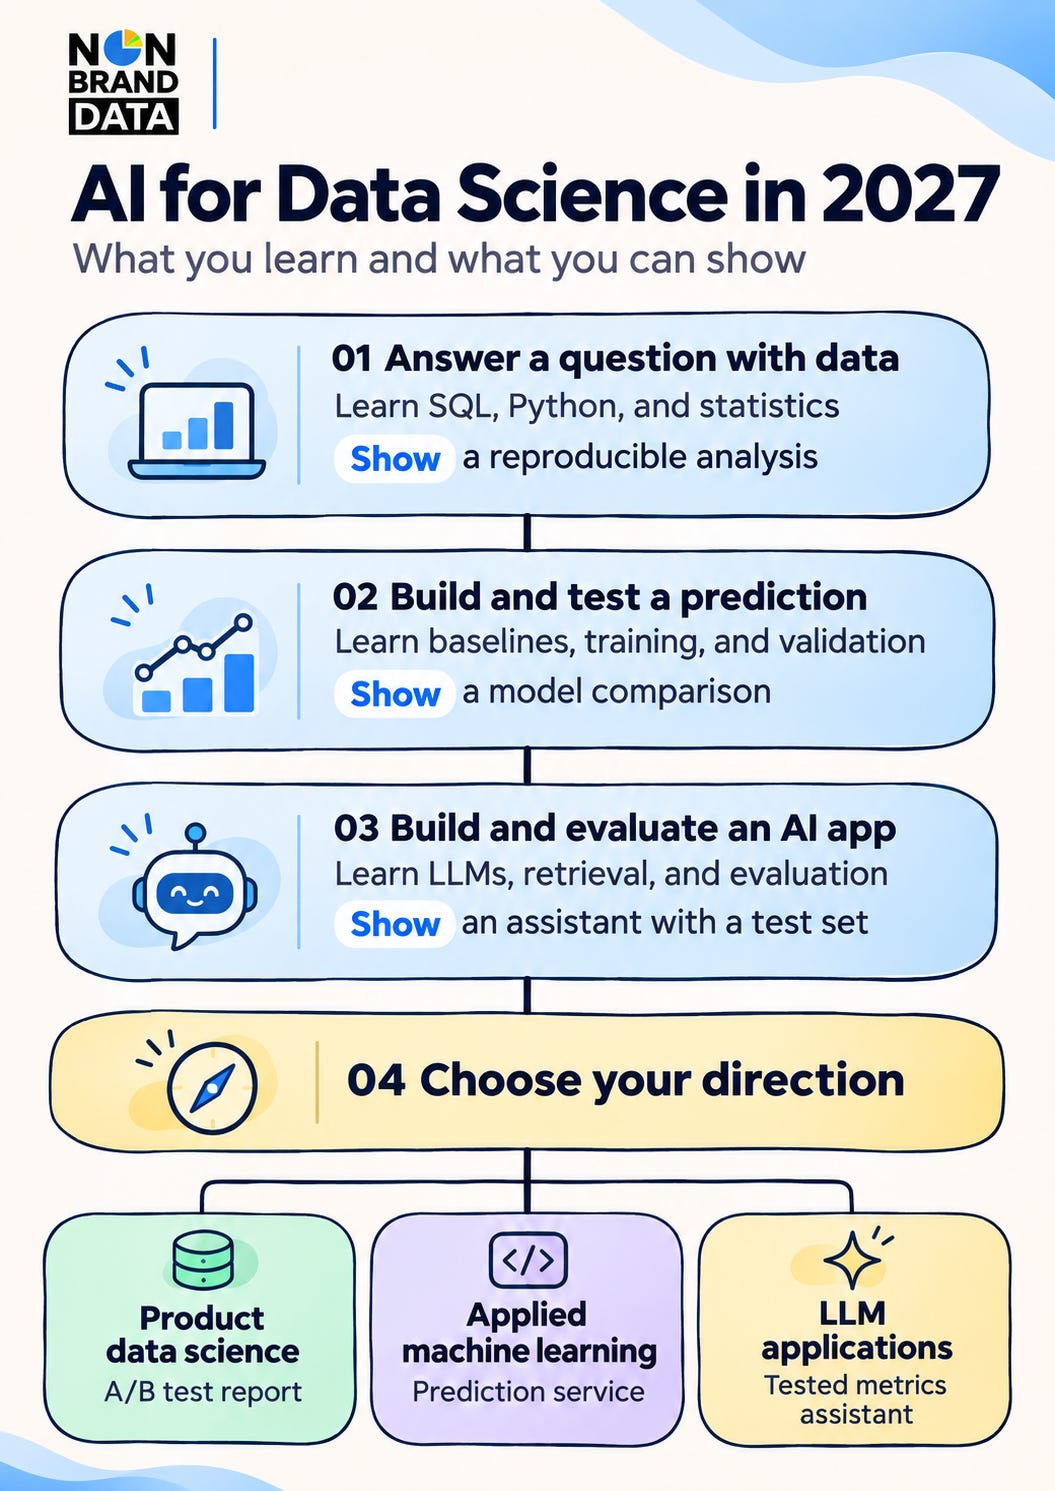
In this article, we will explore a roadmap for learning AI for data science in 2027. We will start with data analysis, move into machine learning and AI applications, and then explore a few areas of specialization. Each section includes the topics to learn, free learning resources, and a project we can develop to apply the skills.
Let’s get into it.
1. Learn to Answer Questions with Data
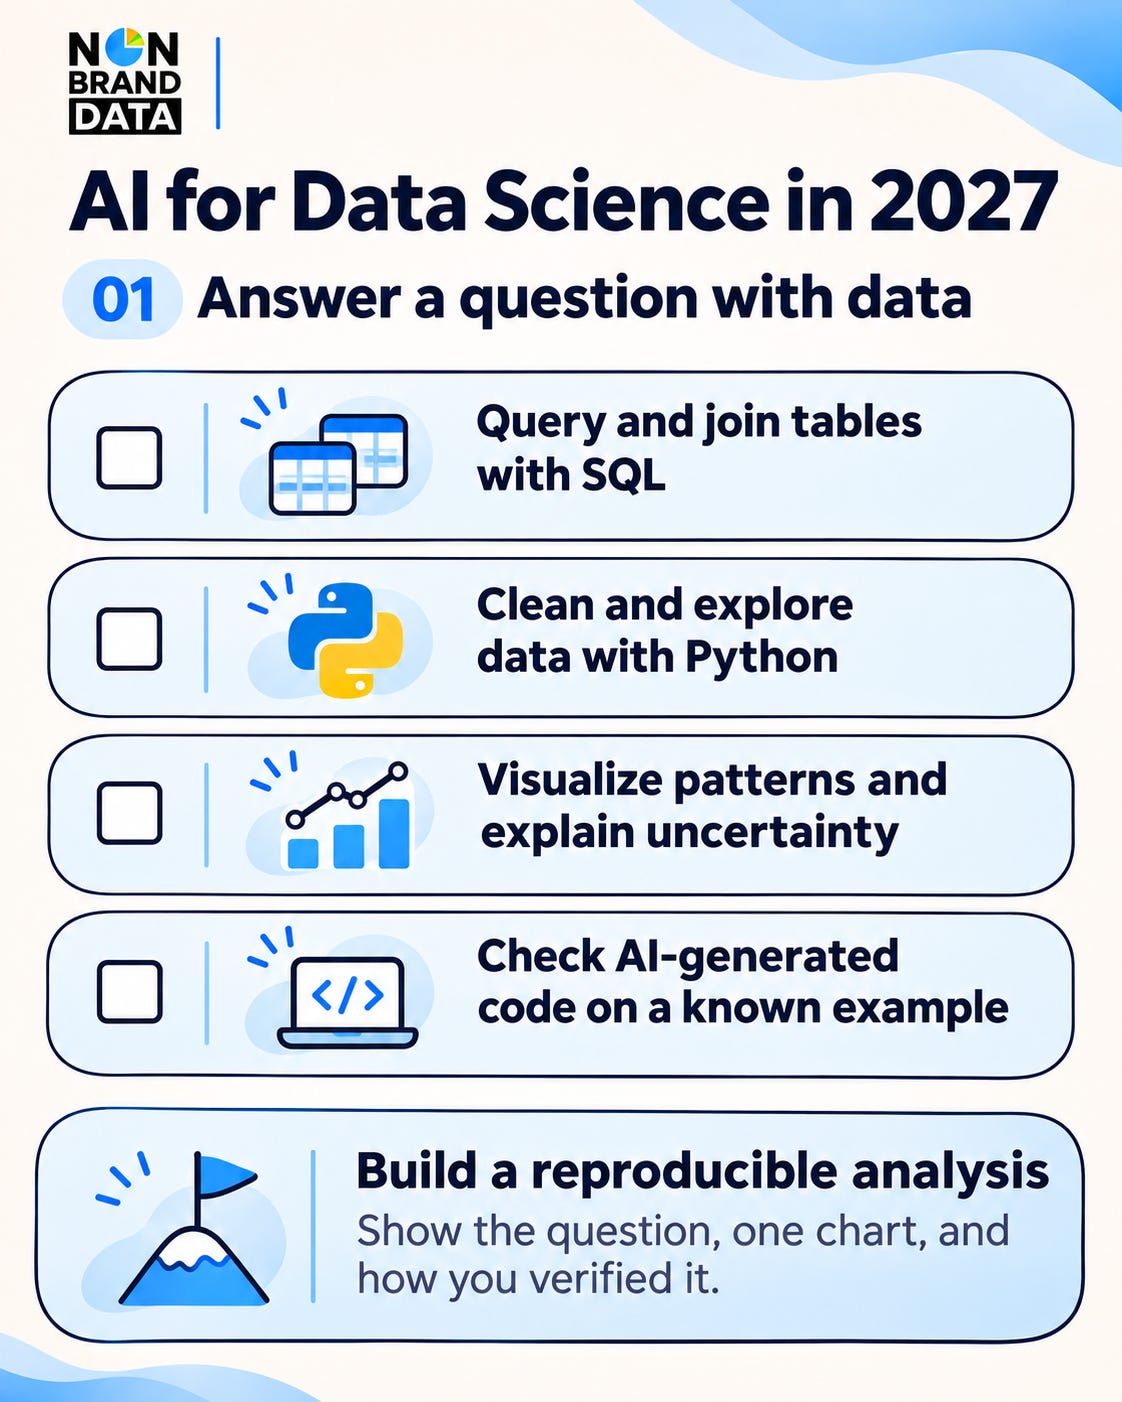
Data analysis is the process of preparing, exploring, and interpreting data to answer a question. It gives us the foundation for the projects we will build throughout this roadmap. For example, we can analyze transaction records to understand which products contribute the most revenue or explore trip records to identify periods of high demand. SQL and Python are useful tools for this work. They appeared in 51% and 66%, respectively, of the 2025 U.S. data scientist job postings tracked by O*NET. O*NET job posting data
What to learn
SQL. SQL allows us to retrieve and summarize data stored in relational databases. Start with SELECT, WHERE, GROUP BY, and aggregate functions such as SUM and COUNT. We can then learn joins to combine tables and window functions to calculate rankings, running totals, and changes between periods. Practice writing queries that answer a specific question. SQLBolt · SQLZoo’s window-function exercises
Python and pandas. First, we need to understand Python variables, data types, conditions, loops, and functions. We can then use pandas to work with tabular data. Learn how to load files, select rows, create columns, handle missing values, and merge datasets. Date parsing and grouping are also useful when we want to analyze results over time. Harvard’s CS50P · Kaggle’s Pandas course
Exploratory analysis and statistics. Exploratory data analysis helps us understand the dataset before drawing conclusions. Learn descriptive statistics, distributions, visualizations, and comparisons between groups. We also need probability, sampling, confidence intervals, and hypothesis testing to interpret results with uncertainty. For example, we can compare average trip durations between two periods and investigate whether a few unusually long trips affect the result. UC Berkeley’s data science textbook
AI-assisted analysis. We can use an AI assistant to explain unfamiliar code, suggest an analysis approach, or help us debug an error. Practice describing the dataset, the question, and the expected output in the request. Then run the code and inspect the result. Learning basic tests helps us identify problems such as a join that duplicates records or a calculation that handles missing values incorrectly. The Microsoft module includes guided coding exercises and supports Copilot Free, which has usage limits. Microsoft Learn’s Copilot with Python module · CS50P’s unit testing lesson
What you should be able to show. Build an analysis of New York City’s public taxi records to explore when and where pickups are busiest. We can prepare the data, summarize trips by hour and location, and visualize the main patterns. Include the analysis code, a description of the cleaning steps, and an explanation of what the results suggest. Completing this project gives us practice taking a question from the raw data to a written finding. NYC taxi trip records
2. Build and Test a Prediction
Machine learning allows us to learn patterns from data and use them to make predictions on new observations. Regression predicts a numerical value, such as demand, while classification predicts a category, such as whether a customer will leave.
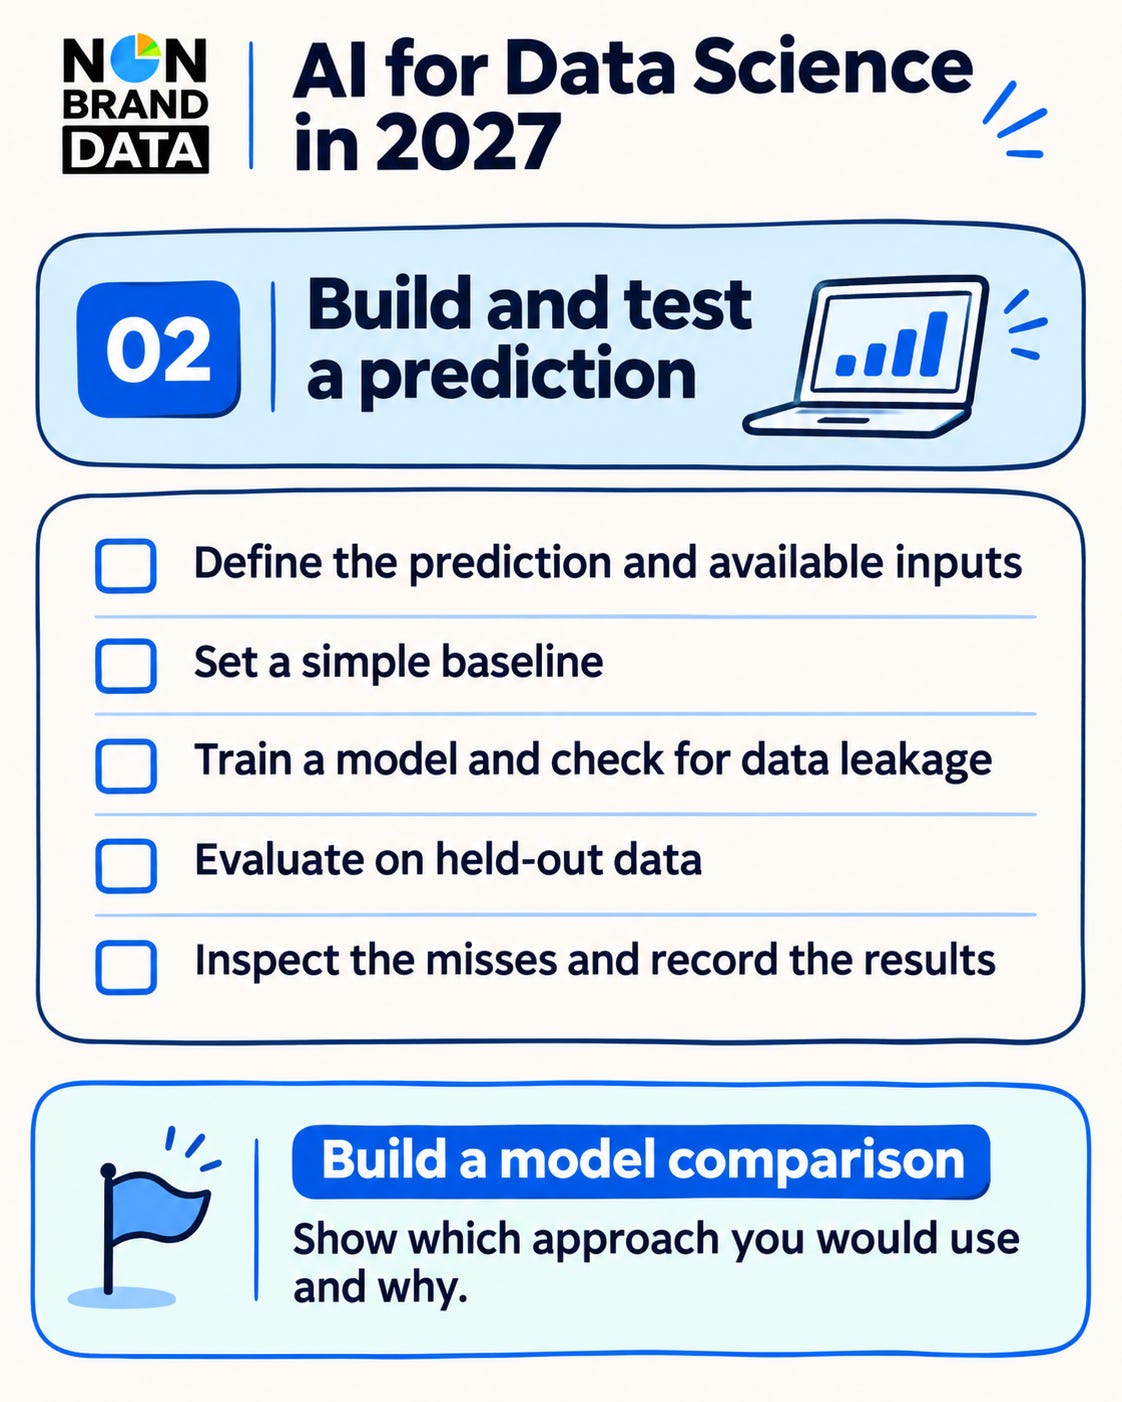
At this stage, we will learn how to prepare training data, develop a model, and evaluate its predictions. A simple baseline gives us a starting point for comparison. For example, when forecasting taxi pickups, we could use the count from the same hour in the previous week before training a more complex model.
What to learn
Problem framing and baselines. First, we need to define what we want to predict and which information will be available when we make the prediction. We can then establish a simple baseline. For classification, this could mean predicting the most common class. For forecasting, we could use the previous period or the same period in the previous week. For practice, study Section 5.2 of The Forecaster’s Toolbox and complete the exercises in Section 5.11 to compare benchmark methods on different datasets.
Model training. Learn linear regression for numerical predictions and logistic regression for classification. We can then explore decision trees and random forests. Practice preparing input features, fitting a model, and generating predictions. Start with the linear and logistic regression modules in Google’s ML Crash Course. For deeper study, use the free Python edition of An Introduction to Statistical Learning. Chapters 3, 4, and 8 cover regression, classification, and tree-based methods, with accompanying Python labs.
Preprocessing and validation. Learn how to handle missing values, encode categories, and scale numerical features when needed. We can combine preprocessing and modeling in a pipeline so that the same steps are applied consistently. Study training and test splits, cross-validation, and data leakage. Work through Kaggle’s Intermediate Machine Learning course, particularly its lessons and exercises on these topics. For forecasting, preserve the order of observations when creating evaluation sets; Section 5.10 of the forecasting book above explains time series cross-validation.
Metrics and error analysis. Evaluation helps us understand how well a model performs on observations it did not learn from. Study mean absolute error for numerical predictions, then precision, recall, and confusion matrices for classification. We can also examine errors across groups or time periods to identify weaknesses hidden by an overall score. Watch StatQuest’s confusion-matrix lesson for a visual introduction. Then work through Made With ML’s evaluation lesson, focusing on overall, per-class, and data-slice performance. Section 5.8 of the forecasting book provides additional practice with numerical evaluation metrics.
What you should be able to show. Extend the taxi analysis into an hourly demand forecasting project. Create features from information available before the forecast, train a model, and compare it with the baseline on the same held-out weeks. Report the average error and examine the busiest hours separately. By completing this stage, we should be able to explain the problem, the training process, and whether the model provides a useful improvement.
3. Build and Evaluate an AI Application
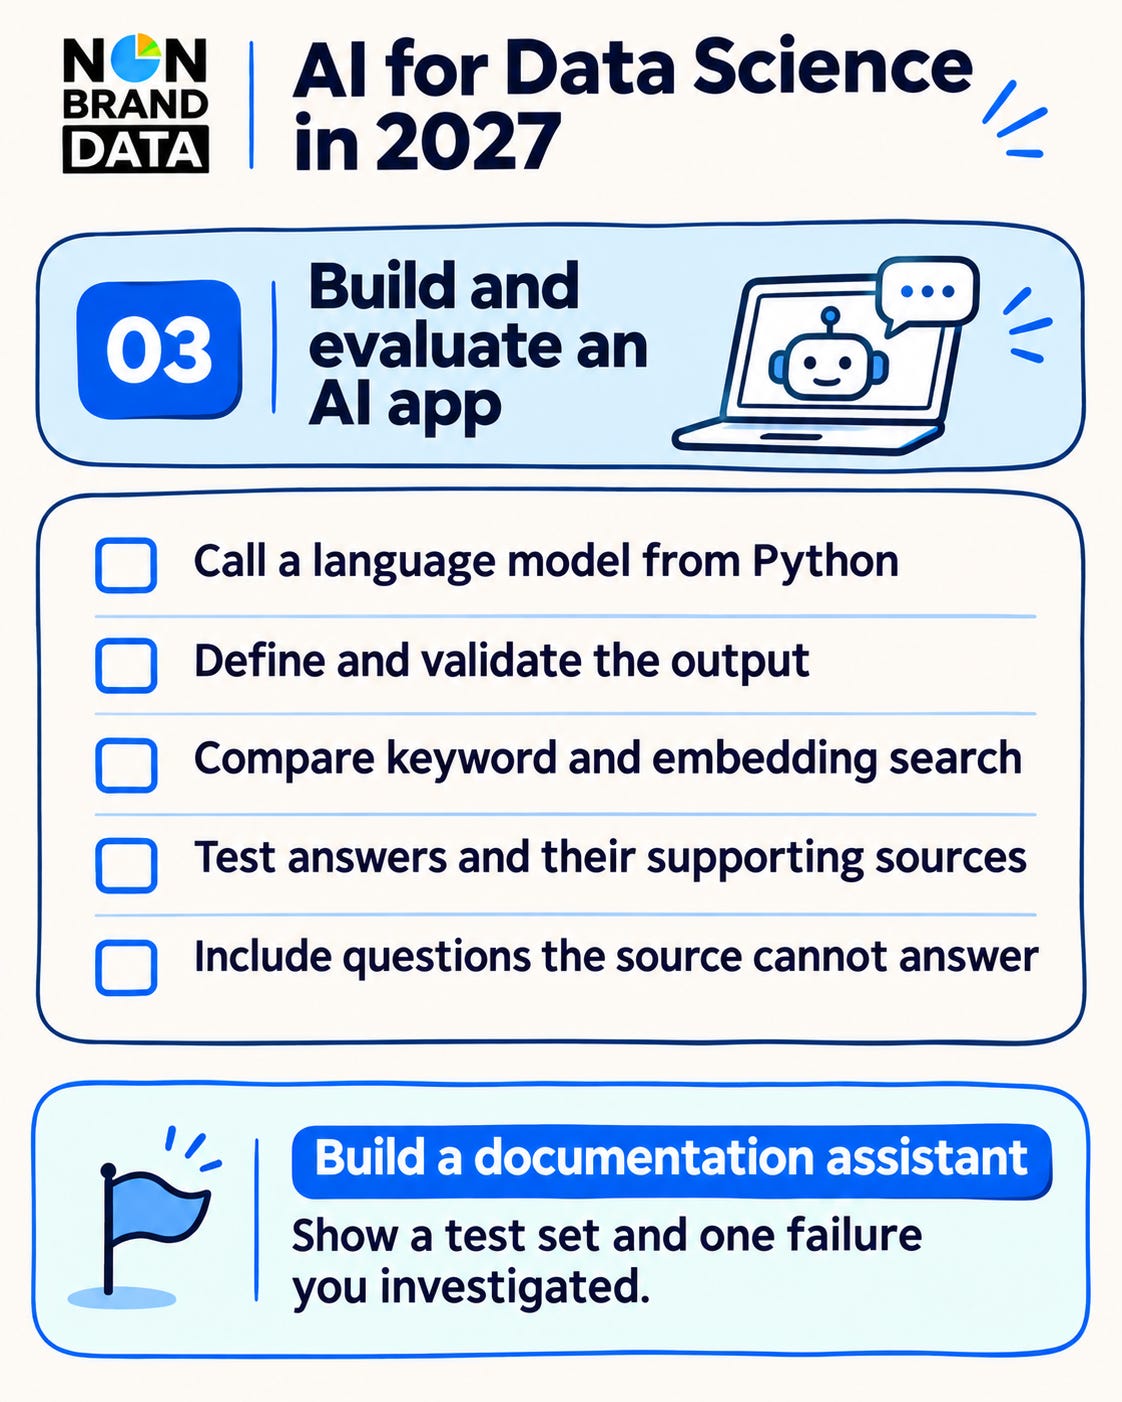
A large language model, or LLM, is a model trained on large collections of text that can generate responses to an input. We can use LLMs for tasks such as summarization, information extraction, and question answering. In a data science project, one application is an assistant that helps readers find information in the data dictionary and analysis notes.
We can begin by including a short document in the prompt. As the collection grows, we can retrieve relevant passages and pass them to the model with the question. This approach is called retrieval-augmented generation, or RAG.
For this stage, we can use Ollama to run a model locally without buying API credits, provided our computer can run the selected model. The learning materials below are free to access. Local practice depends on our hardware; when a course uses a hosted API, we can study its examples and adapt the exercise to a local model to avoid API-credit costs. freeCodeCamp’s local AI course
What to learn
Call a model from Python. Learn how to send a request from Python and read the model response. Practice writing instructions, supplying context, and giving examples of the expected answer. We also need to understand tokens, which are the units of text a model processes, and the context window, which limits how much input and output it can handle in a request. freeCodeCamp’s Python API lesson
Define and validate the output. Some applications need a predictable response structure. We can ask the model to return fields such as an answer and a source reference, then validate the response against a schema. Practice handling missing fields and invalid values. A valid structure makes the response easier to use in an application, while factual accuracy still needs a separate evaluation. freeCodeCamp’s structured-output tutorial
Compare retrieval methods. Keyword search finds passages through matching words, while embedding search uses numerical representations to find passages with similar meaning. Learn how to split documents into passages, create embeddings, and retrieve relevant results. We can compare both methods with questions whose supporting passages we already know. This helps us understand whether retrieval gives the model the information needed to answer. Hugging Face’s semantic-search lesson
Evaluate the answers. Create a set of questions before adjusting the prompt or retrieval settings. Evaluate whether each answer is correct, whether its source supports the claim, and how the application responds when the documents do not contain the answer. Record the model, prompt, response time, and token counts. We can use these results to compare versions and identify which part of the application needs improvement. LLM Zoomcamp’s evaluation lessons
What you should be able to show. Build an assistant for the taxi dataset documentation and project notes. Prepare around 20 evaluation questions, including questions the documents cannot answer. Compare two versions, such as keyword retrieval and embedding retrieval, and explain the results. When an answer is incorrect, inspect the retrieved passages before changing the prompt. The completed project should show that we can build an LLM application and evaluate how well it works.
4. Choose a Direction for Your Portfolio
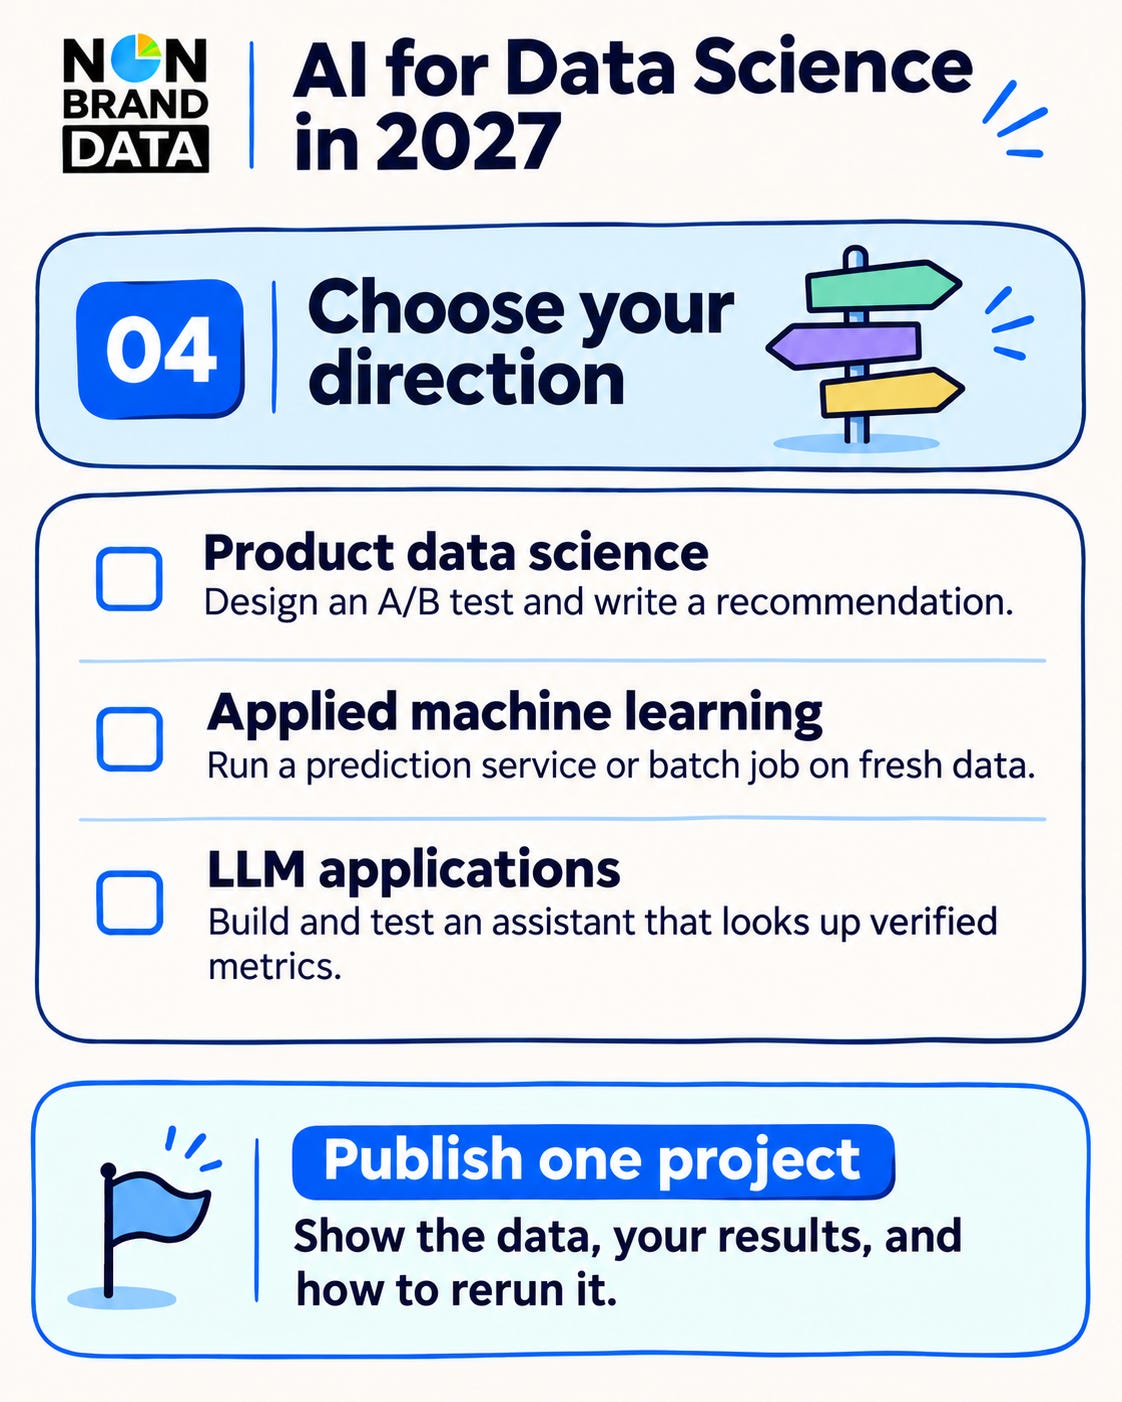
The previous sections give us a foundation in analysis, predictive modeling, and LLM applications. We can then choose an area to study in more depth based on the work we want to do. Each direction builds on the same foundations but emphasizes a different type of problem.
Below are three directions we can explore, along with a project to develop for each one.
Product data science. Product data science focuses on understanding user behavior and evaluating product decisions. Study metric definitions, experiment design, randomization, and the interpretation of A/B tests. For a project, design an experiment with a primary metric and a guardrail metric that tracks a possible unwanted effect. We can simulate the results and write a recommendation that explains the estimated effect and its uncertainty. Udacity’s free A/B Testing course · OpenIntro Statistics
Applied machine learning. Applied machine learning includes making a trained model usable beyond the development notebook. Learn how to save the model, organize reusable code, validate inputs, and run predictions through a batch job or API. We can extend the forecasting project into a small prediction service and test it on fresh data. Add monitoring for changes in the inputs and evaluate prediction quality when new outcomes become available. Made With ML scripting · Evidently’s free observability course · ML Zoomcamp’s deployment workshop
LLM applications. LLM applications can combine document retrieval with tools that perform a specific operation. Learn how tool calling works, how to validate the arguments, and how to handle an unsuccessful request. For a project, extend the assistant with a read-only function that calculates a defined metric from the dataset. Test whether it selects the correct function, passes valid inputs, and explains the returned result accurately. Hugging Face’s Agents fundamentals unit
Once we have chosen a direction, we can develop one of these projects into a portfolio piece. Include a README that explains the problem, the dataset, the methods, and the results. Document the setup so another person can run the project, and discuss its limitations. This gives us a complete example of how we apply the skills and explain the decisions made during development. CodeRefinery’s reproducible-research workshop
Conclusion
In this article, we have explored a roadmap for learning AI for data science in 2027. We started with SQL, Python, and statistics for data analysis, followed by machine learning development and LLM applications. We also explored product data science, applied machine learning, and LLM applications as directions for further learning.
We can work through the roadmap by completing a project at each stage: an analysis, a predictive model, and an evaluated AI application. The free resources give us material to study, while the projects give us a way to apply the concepts and explain what we have learned.
I hope it helps!
Continue Learning with Non-Brand Data
If you’d like help choosing your next project, working through a technical challenge, or deciding what to learn next, I offer 1-on-1 mentorship through MentorCruise. We can use this roadmap to plan your next step based on what you already know and what you want to build.