

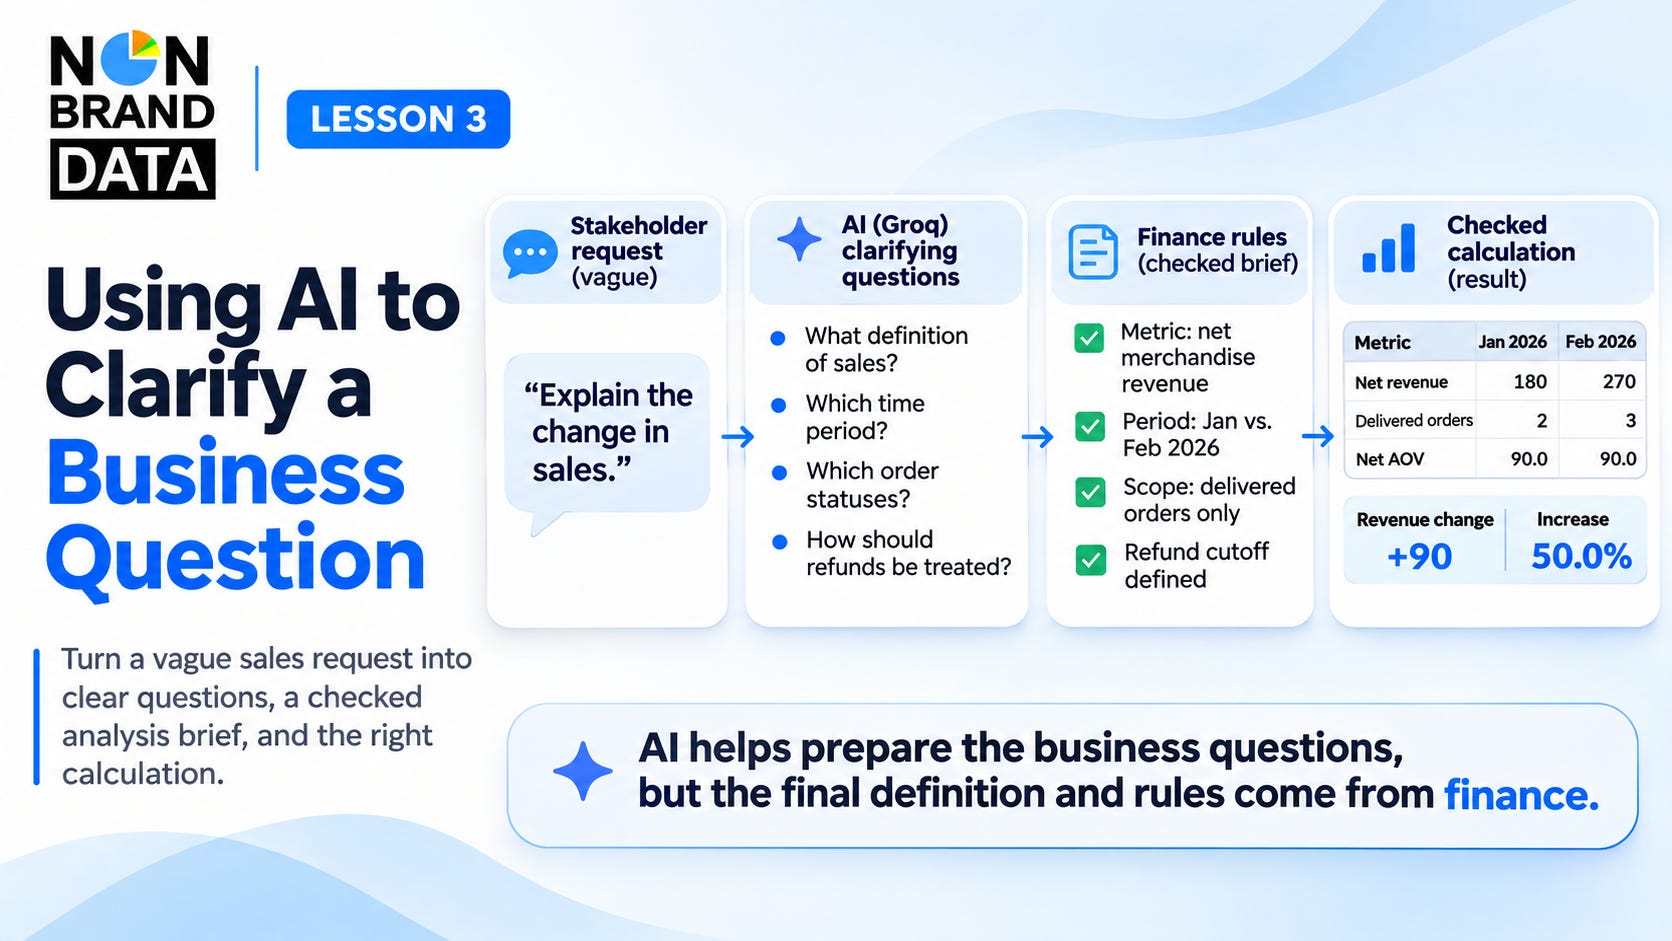
When someone asks us to explain a change in sales, it’s tempting to open the dataset and start adding up the orders. Before we do that, what does sales mean in the report? The sales team might want to know how much customers ordered, while finance might need the revenue after discounts and refunds.
We can use AI to prepare for that conversation. If we give it the request and describe the data we have, it can suggest questions we might have missed. A refund recorded in March for an order placed in January is one example. Which month should we put it in?
In this lesson, we’ll use Groq to prepare questions for a fictional retail business. We’ll go through its suggestions, use the answers from finance to write an analysis brief, and try two sales calculations with the same data. You can follow along in Google Colab using the function we set up in Lesson 2.
Let’s start with the sales request.
