RAG Evaluation Monitoring and Logging with Opik
NBD Lite #53 How you splitting your data can affect the RAG performance
All the code used here is present in the RAG-To-Know repository.
Hi all! It’s been a while, but we are now back again with the new edition for the RAG-To-Know series!
Our previous article discussed improving RAG performance using various Chunking Strategies. This strategy is good, but as the experiment continues, we want to monitor whether the performance is stable or if there is any significant shift with new queries.
When we talk about monitoring and logging in the RAG application, it is not just about accuracy; it should revolve around the entire pipeline, mainly since the RAG application contains two essential parts: Retrieval and Generation.
Monitoring and evaluating both parts become essential in production for many reasons, including:
Quality Assurance: Regular evaluations help maintain high standards, ensuring the system's outputs remain accurate and relevant.
System Reliability: Monitoring critical metrics enables early detection of issues, allowing for timely corrective actions to maintain system stability.
User Trust: Consistently accurate and relevant responses nurture user confidence in the system's capabilities.
Since assessing and monitoring your RAG pipeline is crucial, this article will examine how to evaluate and track it effectively.
Curious about it? Let’s get into it!
Introduction to RAG Evaluation
We learned how the RAG works conceptually previously. If you somehow missed it, you can visit the article below.
RAG system mainly functions to help improve LLM generate the text output by providing additional context via the knowledge base we set up previously.
If we make it into the diagram, the RAG structure basically looks like the image below.
As the RAG system consists of both retrieval and generation components, evaluating its quality should focus on both rather than just generation.
Generally, we evaluate the retrieval and generation separately to have an easier time debugging them and understanding any issues that arise in each component.
The parameters and the selection of the component tools influence each component. It’s essential to assess and adjust these parameters to balance relevance, cost, and quality. For example:
Embedding choice shapes relevance: the selected embedding model influences how effectively your system understands domain-specific nuances.
Retrieval sizing balances context: top-K and chunk granularity manage the amount of information you retrieve versus what you require.
Store setup impacts efficiency: the structure of your vector database and the method of populating it determine retrieval speed and accuracy.
Model and sampling trade-off between cost and quality: selecting the LLM size and temperature settings influences response fidelity and latency expense.
Prompt design guides coherence; how you frame context and instructions influences the clarity and reliability of the LLM’s output.
By focusing your RAG evaluation on these core parameters, we can more quickly identify bottlenecks, optimize performance, and reduce costs in the pipeline.
The selection of parameters needs metrics that reflect the retrieval and generation parts. Many metrics can be used, including:
Contextual Precision: ensures your reranker orders truly relevant chunks at the top. (Retrieval)
Contextual Recall: measures if your embedding model retrieves all contextually relevant information. (Retrieval)
Relevancy: checks whether chunk size and top-K settings minimize irrelevant results. (Retrieval)
Answer relevancy: ensures your prompt template guides the LLM in producing on-topic, helpful responses. (Generation)
Faithfulness or Hallucination: verifies your LLM’s outputs remain factual and free of hallucinations. (Generation)
These metrics are often evaluated using the LLM-as-a-Judge technique, which we have discussed in our previous article.
Experimenting and monitoring the retrieval and generation metrics is essential for a reliable RAG pipeline. Therefore, we are building a monitoring system to track all the metrics we experiment with.
How to build this evaluation monitoring system? Let’s explore it further.
Building RAG Pipeline Monitoring System
There are many RAG pipeline monitoring tools, but we will use Comet's Opik, an Open-Source LLM Application Monitoring tool. It evaluates and monitors our RAG system using a simple Python workflow.
We will set up and configure the RAG pipeline similarly to the one explained in the Simple RAG Implementation.
The first thing we need to do is register with the Opik and acquire the Project API Key.
Once you have acquired the API Key, install the necessary library.
pip install opikThen, we will import all the essential libraries necessary for monitoring the RAG pipeline.
import os

import pandas as pd

import PyPDF2

from sentence_transformers import SentenceTransformer

import chromadb
from chromadb.config import Settings

import litellm
from litellm import completion
from litellm.integrations.opik.opik import OpikLogger

from langchain.text_splitter import RecursiveCharacterTextSplitter

from opik import track, Opik
from opik.opik_context import get_current_span_data
from opik.evaluation import evaluate, models
from opik.evaluation.metrics import Hallucination, ContextRecall, ContextPrecision


## Set environment variables. Uncomment this if you want to set them directly.
# os.environ["HUGGINGFACE_TOKEN"] = "YOUR_HF_TOKEN"
# os.environ["GEMINI_API_KEY"] = "YOUR_GEMINI_TOKEN"
# os.environ['LITELLM_LOG'] = 'DEBUG'

# os.environ["OPIK_API_KEY"] = "YOUR_API_OPIK_TOKEN"
# os.environ["OPIK_WORKSPACE"] = "YOUR_WORKSPACE_NAME"
# os.environ["OPIK_PROJECT_NAME"] = "YOUR_PROJECT_NAME"

# GEMINI_API_KEY = "YOUR_GEMINI_TOKEN"
Pass all the necessary API keys and create the project name that you feel is appropriate. We will skip some code implementation and only show the important monitoring part.
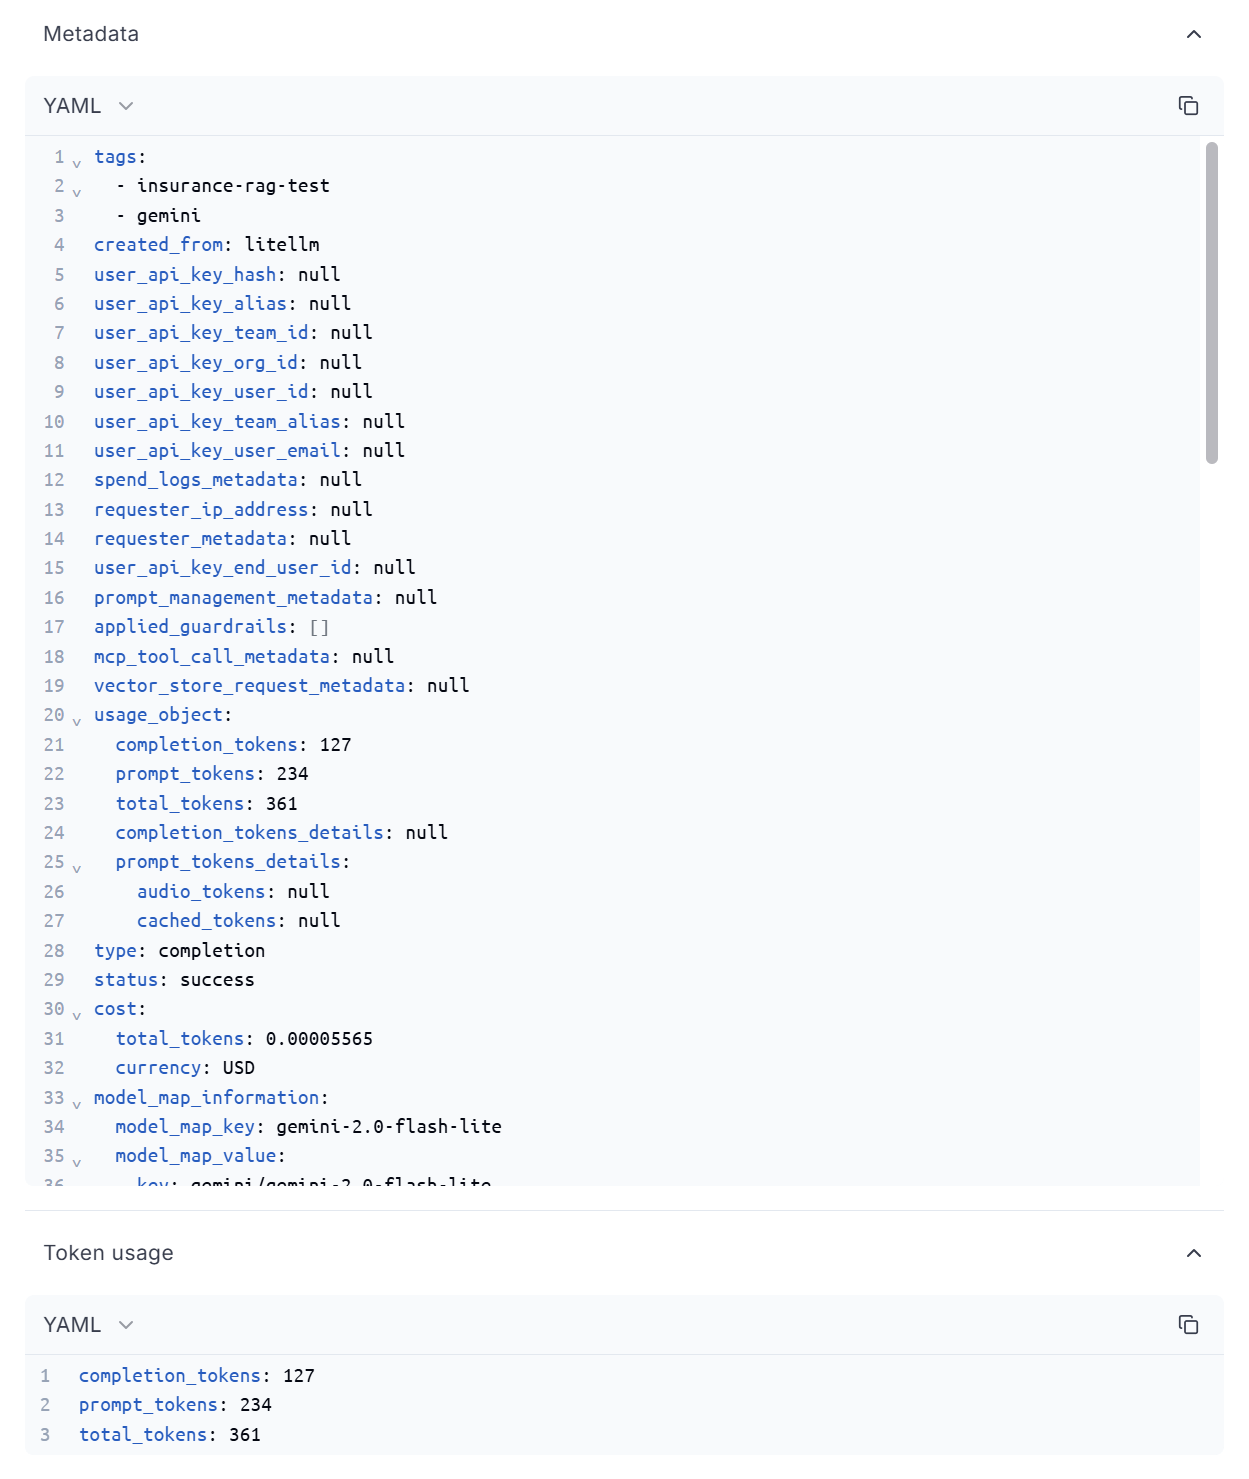
In this code, we try to monitor LiteLLM's input and output with Opik, including the prompt used and the metadata (such as cost and token usage).
# Set up LiteLLM with Gemini and Monitor the result with Opik
opik_logger = OpikLogger()
litellm.callbacks = [opik_logger]

model_name = "gemini/gemini-2.0-flash-lite"
query = "What is the insurance for car?"

@track
def generate_response(query: str, context: str):
    # build the prompt
    prompt = f"Query: {query}\nContext: {context}\nAnswer:"

    # call Gemini via LiteLLM
    response = completion(
        model=model_name,
        messages=[{"role": "user", "content": prompt}],
        api_key=GEMINI_API_KEY,
        metadata = {
            "opik": {
                "current_span_data": get_current_span_data(),
                "tags": ["insurance-rag-test"],
            }
            }
    )

    # extract the generated text
    generated = response["choices"][0]["message"]["content"]
    return generated

# perform semantic search
search_results = semantic_search(query)
context = "\n".join(search_results["documents"][0])

# generate the completion
response = generate_response(query, context)

print("Generated Response:\n", response)
The UI shows that the LLM function calls are monitored, and each call has a unique ID.
If you select one of the data points, you can access more detailed information about the process, such as the calling time, token usage, and cost.
You can even check the metadata if you want, as it contains a much more detailed explanation of the call.
Next, we will try to perform the RAG pipeline evaluation. We use the insurance QA previously generated in the LLM-as-a-Judge article for the evaluation dataset.
insurance_qa = pd.read_csv('/content/dataset/96_sample_insurance_qa.csv')

examples = [
    {
        "input": q, "context": c, "expected_output": a
    }
    for q, c, a in zip(
        insurance_qa["question"],
        insurance_qa["context"],
        insurance_qa["answer"]
    )
]

client = Opik()
dataset = client.get_or_create_dataset(name="Insurance-96-QA-Dataset")

dataset.insert(examples)
Using the dataset above, we will perform an evaluation experiment over our RAG pipeline with the following metric:
Hallucination
Context Precision
Context Recall
To do that, we can use the following code:
def evaluation_task(x: dict) -> dict:
    answer = generate_response(x["input"], x["context"])
    return {
        "input": x["input"],
        "output": answer,
        "context": x["context"],
        "expected_output": x["expected_output"]
    }


experiment_config = {
    "model_id": "gemini/gemini-2.0-flash-lite",
    "embedding_model_id": "all-MiniLM-L6-v2"
}

model = models.LiteLLMChatModel(
    model_name="gemini/gemini-2.0-flash-lite"
)

scoring_metrics = [
    Hallucination(model=model),
    ContextRecall(model=model),
    ContextPrecision(model=model)
]

evaluate(
    dataset=dataset,
    task=evaluation_task,
    scoring_metrics=scoring_metrics,
    experiment_config=experiment_config,
    task_threads=1,
    nb_samples=9 #use only 9 samples
)
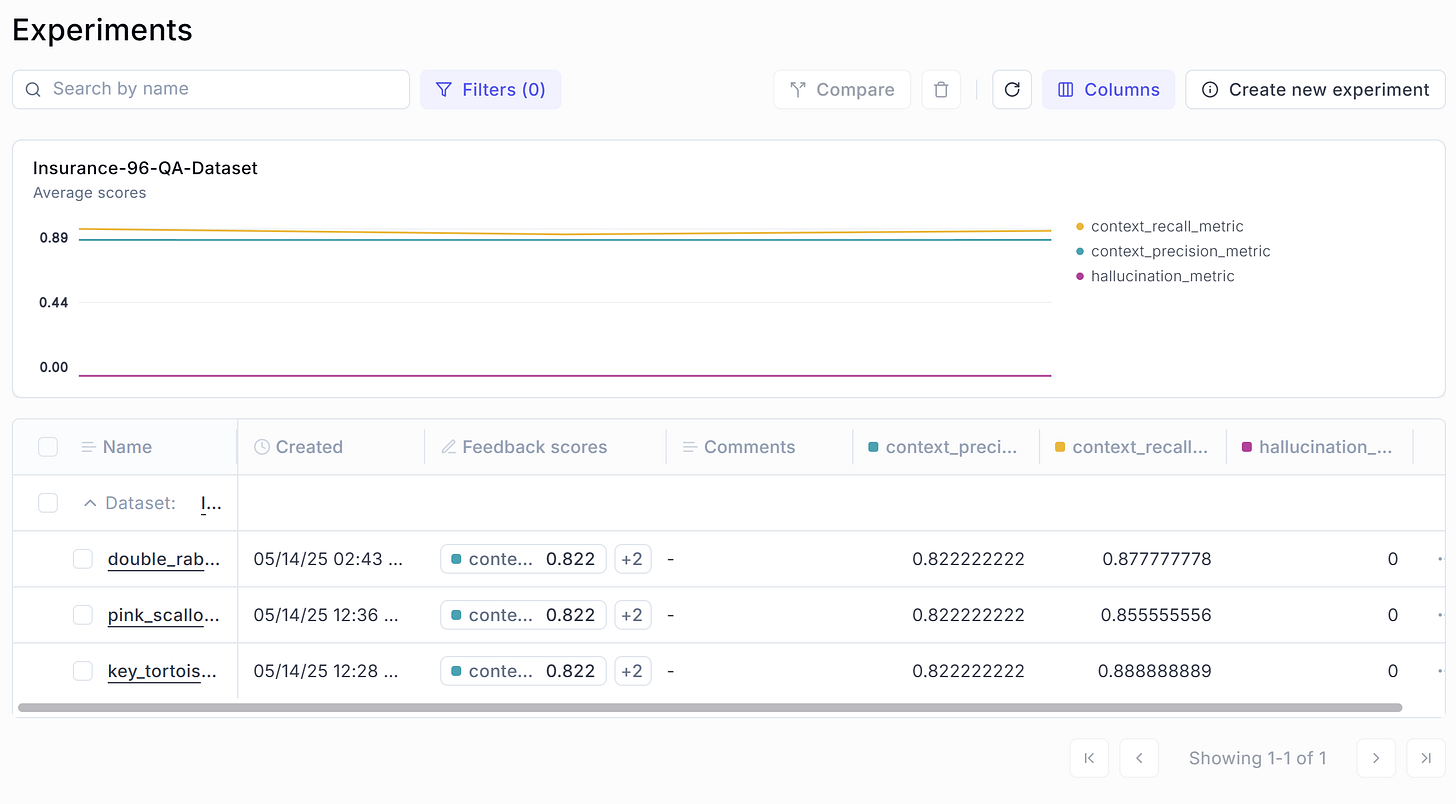
In the code above, we set up the model for LLM-as-a-Judge and use the prompt metric provided by Opik. Let’s check out the evaluation result.
All the metrics we previously set up are now monitored within the Opik UI. If you click on each individual experiment, you can see more evaluation details.
You can check the following Opik metric documentation to select the prompt you need. Explore their documentation to learn more about what you can monitor and how it helps your project in the long run.
That’s all for now. The whole code for monitoring and logging with Opik is available in the RAG-To-Know repository.
Is there anything else you’d like to discuss? Let’s dive into it together!
👇👇👇
If you're at a pivotal point in your career or sitting on skills you're unsure how to use, I offer 1:1 mentorship.
It's personal, flexible, and built around you.
For long-term mentorship, visit me here (you can even enjoy a 7-day free trial).


